Advertisement
- China
- /
- Electronic Equipment and Components
- /
- SZSE:300679
High Growth Tech Stocks In Asia Featuring Montnets Cloud Technology Group

Simply Wall St
Reviewed by Simply Wall St

The Asian tech market has been navigating a complex landscape marked by evolving trade tensions and economic indicators, with small- and mid-cap indexes showing resilience amid global uncertainties. In this environment, identifying high-growth tech stocks like Montnets Cloud Technology Group requires careful consideration of their adaptability to market shifts and potential for innovation-driven growth.
Top 10 High Growth Tech Companies In Asia
| Name | Revenue Growth | Earnings Growth | Growth Rating |
|---|---|---|---|
| Suzhou TFC Optical Communication | 28.00% | 28.07% | ★★★★★★ |
| Eoptolink Technology | 26.83% | 26.04% | ★★★★★★ |
| Fositek | 29.05% | 34.17% | ★★★★★★ |
| Range Intelligent Computing Technology Group | 28.34% | 29.48% | ★★★★★★ |
| eWeLLLtd | 24.66% | 25.31% | ★★★★★★ |
| PharmaEssentia | 32.31% | 59.75% | ★★★★★★ |
| Nanya New Material TechnologyLtd | 22.72% | 63.29% | ★★★★★★ |
| PharmaResearch | 21.74% | 25.00% | ★★★★★★ |
| giftee | 21.13% | 67.05% | ★★★★★★ |
| JNTC | 34.26% | 86.00% | ★★★★★★ |
We'll examine a selection from our screener results.
Montnets Cloud Technology Group (SZSE:002123)
Simply Wall St Growth Rating: ★★★★☆☆
Overview: Montnets Cloud Technology Group Co., Ltd. operates in the cloud communication services sector, with a market cap of approximately CN¥12.04 billion.
Operations: The company focuses on providing cloud communication services, generating revenue primarily from its messaging and related solutions. As of the latest data, it holds a market cap of approximately CN¥12.04 billion.
Montnets Cloud Technology Group has shown a robust turnaround, becoming profitable this year with an impressive earnings growth forecast of 61.8% per year, outpacing the Chinese market's average of 23.9%. Despite a recent dip in quarterly revenue to CNY 720.75 million from CNY 1,100.15 million year-over-year and net income falling to CNY 3.73 million from CNY 8.84 million, the company's annual figures tell a story of recovery: full-year revenue rose to CNY 4,403.67 million from a previous loss-heavy period with net income improving dramatically to CNY 38.17 million from a significant loss of CNY -1,822.49 million last year. These financials highlight Montnets' resilience and adaptability in navigating market challenges while maintaining an upward trajectory in profitability within the competitive tech landscape in Asia.

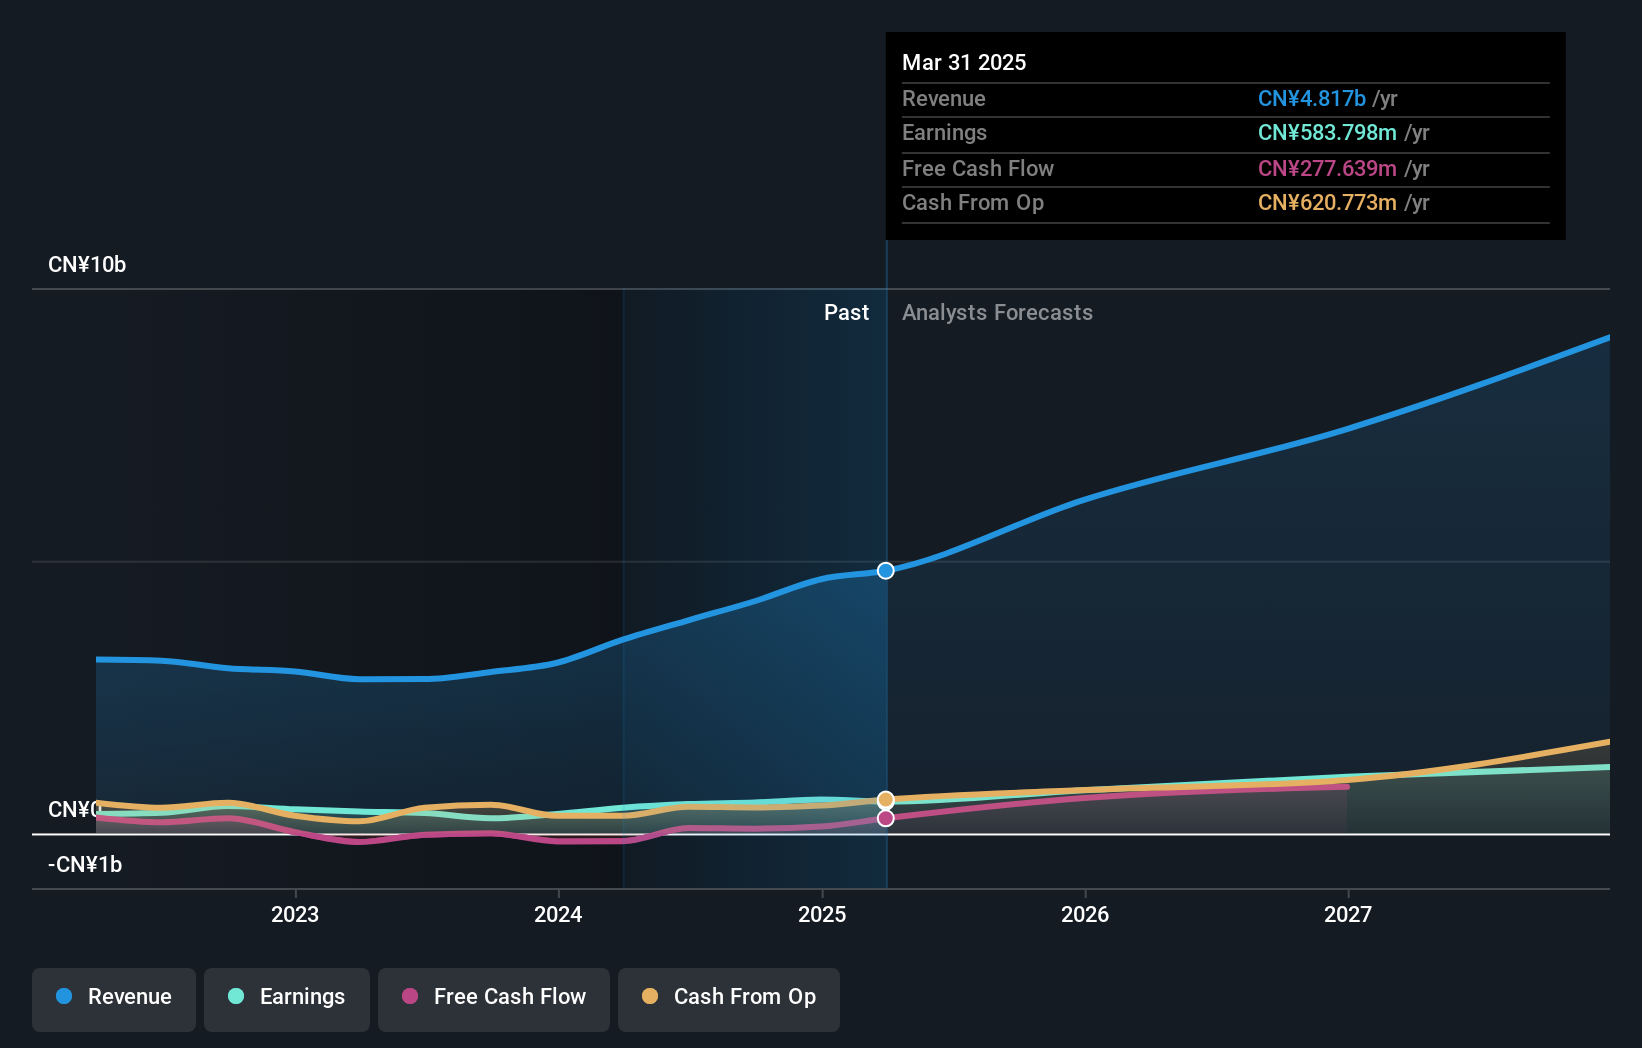
Electric Connector Technology (SZSE:300679)
Simply Wall St Growth Rating: ★★★★★☆
Overview: Electric Connector Technology Co., Ltd. specializes in the research, design, development, manufacture, sale, and marketing of electronic connectors and interconnection system products globally with a market cap of CN¥20.90 billion.
Operations: The company focuses on the production and global distribution of electronic connectors and interconnection system products. Its operations encompass technical research, design, development, manufacturing, sales, and marketing.
Electric Connector Technology has demonstrated a promising trajectory in the competitive Asian tech sector, with a significant annual revenue growth rate of 21.5% and earnings expanding by 27.9% annually. Notably, the company's commitment to innovation is underscored by its R&D expenditures, which have consistently aligned with or exceeded industry averages, positioning it well for sustained technological advancements and market responsiveness. Recent strategic moves include a proposed dividend increase and substantial investments in employee incentives, reflecting confidence in ongoing growth and stability. These efforts are complemented by recent earnings reports showing robust sales increases year-over-year, despite slight fluctuations in net income—evidence of Electric Connector's agility in navigating market dynamics while fostering substantial long-term value creation.
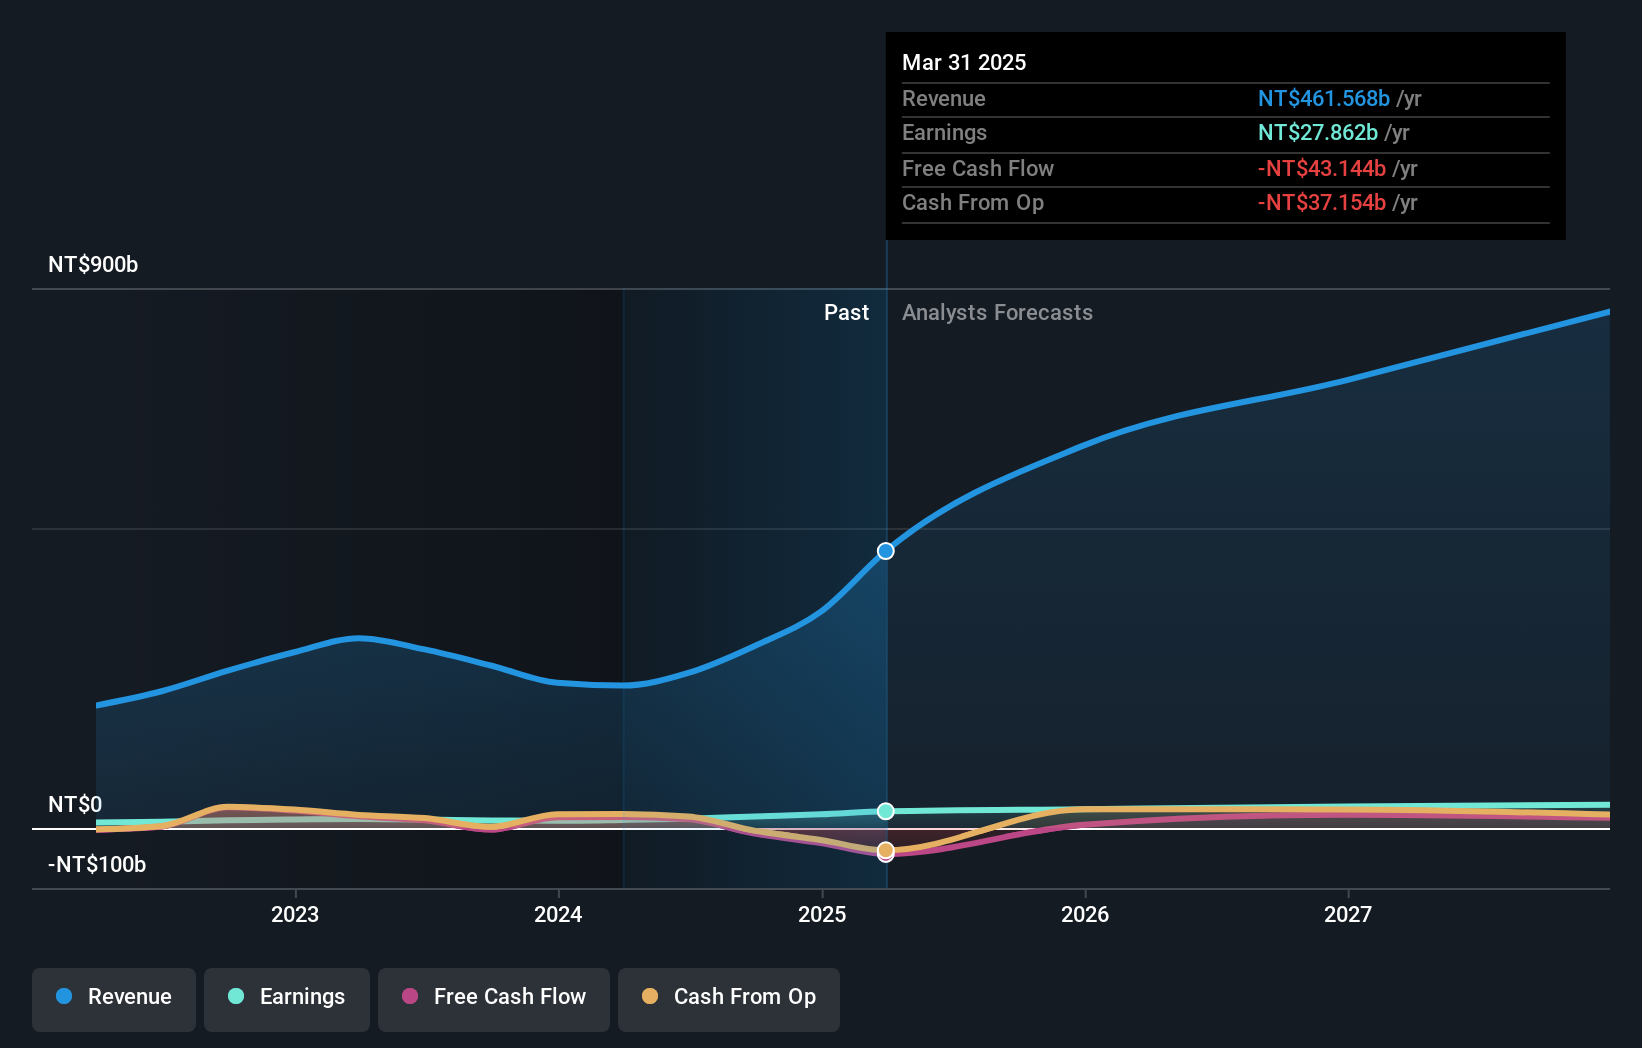
Wiwynn (TWSE:6669)
Simply Wall St Growth Rating: ★★★★★☆
Overview: Wiwynn Corporation is involved in the research, development, design, testing, and sales of semi products and peripheral equipment globally, with a market cap of NT$399.56 billion.
Operations: The company generates revenue primarily from its computer hardware segment, amounting to NT$360.54 billion.
Wiwynn Corporation's recent performance underscores its robust position in the high-growth tech sector in Asia, with a remarkable increase in sales to TWD 170.66 billion and net income doubling to TWD 9.79 billion for Q1 2025 from the previous year. This financial upswing is complemented by strategic product innovations such as their AI servers featuring NVIDIA Blackwell Ultra, which are set to enhance computing capabilities significantly. Moreover, Wiwynn's forward-looking approach is evident from their R&D focus, crucial for maintaining technological leadership and addressing the exponential demand in AI-driven markets. Their recent dividend increase also signals strong confidence in sustained profitability and shareholder value.
- Click to explore a detailed breakdown of our findings in Wiwynn's health report.
Examine Wiwynn's past performance report to understand how it has performed in the past.
Where To Now?
- Click through to start exploring the rest of the 478 Asian High Growth Tech and AI Stocks now.
- Invested in any of these stocks? Simplify your portfolio management with Simply Wall St and stay ahead with our alerts for any critical updates on your stocks.
- Streamline your investment strategy with Simply Wall St's app for free and benefit from extensive research on stocks across all corners of the world.
Ready For A Different Approach?
- Explore high-performing small cap companies that haven't yet garnered significant analyst attention.
- Fuel your portfolio with companies showing strong growth potential, backed by optimistic outlooks both from analysts and management.
- Find companies with promising cash flow potential yet trading below their fair value.
This article by Simply Wall St is general in nature. We provide commentary based on historical data and analyst forecasts only using an unbiased methodology and our articles are not intended to be financial advice. It does not constitute a recommendation to buy or sell any stock, and does not take account of your objectives, or your financial situation. We aim to bring you long-term focused analysis driven by fundamental data. Note that our analysis may not factor in the latest price-sensitive company announcements or qualitative material. Simply Wall St has no position in any stocks mentioned.
Valuation is complex, but we're here to simplify it.
Discover if Electric Connector Technology might be undervalued or overvalued with our detailed analysis, featuring fair value estimates, potential risks, dividends, insider trades, and its financial condition.
Access Free AnalysisHave feedback on this article? Concerned about the content? Get in touch with us directly. Alternatively, email editorial-team@simplywallst.com
About SZSE:300679
Electric Connector Technology
Engages in the research, design, development, manufacture, and sale of micro electronic connectors and interconnection system related products in China, North America, Europe, Japan, Asia Pacific, and internationally.
Flawless balance sheet with high growth potential.
Market Insights


Advertisement
Community Narratives
The Future of Drug Testing? Fingerprint Tech Shows Serious Promise
Fair Value US$2.98|40.3% undervalued
JO
Community Contributor
Suncorp’s Next Chapter: Insurance-Only and Ready to Grow
Fair Value AU$22.83|7.9% undervalued
RO
Community Contributor
Thyssenkrupp Nucera Will Achieve Double-Digit Profits by 2030 Boosted by Hydrogen Growth
Fair Value €14.40|31.6% undervalued
CH
Community Contributor
Tesla’s Nvidia Moment – The AI & Robotics Inflection Point
Fair Value US$359.72|12.3% undervalued
BL
Community Contributor