
Advertisement
- China
- /
- Communications
- /
- SZSE:300134
Anhui Tatfook Technology Co., Ltd's (SZSE:300134) Share Price Boosted 30% But Its Business Prospects Need A Lift Too
Those holding Anhui Tatfook Technology Co., Ltd (SZSE:300134) shares would be relieved that the share price has rebounded 30% in the last thirty days, but it needs to keep going to repair the recent damage it has caused to investor portfolios. Unfortunately, the gains of the last month did little to right the losses of the last year with the stock still down 12% over that time.
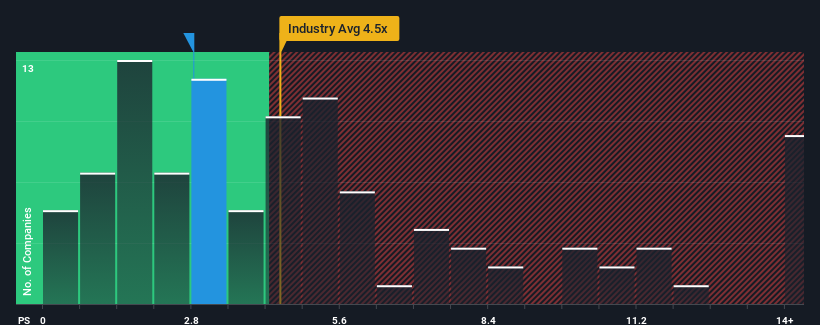
Even after such a large jump in price, Anhui Tatfook Technology may still be sending buy signals at present with its price-to-sales (or "P/S") ratio of 2.8x, considering almost half of all companies in the Communications industry in China have P/S ratios greater than 4.5x and even P/S higher than 8x aren't out of the ordinary. Nonetheless, we'd need to dig a little deeper to determine if there is a rational basis for the reduced P/S.
View our latest analysis for Anhui Tatfook Technology
What Does Anhui Tatfook Technology's P/S Mean For Shareholders?
As an illustration, revenue has deteriorated at Anhui Tatfook Technology over the last year, which is not ideal at all. Perhaps the market believes the recent revenue performance isn't good enough to keep up the industry, causing the P/S ratio to suffer. Those who are bullish on Anhui Tatfook Technology will be hoping that this isn't the case so that they can pick up the stock at a lower valuation.
We don't have analyst forecasts, but you can see how recent trends are setting up the company for the future by checking out our free report on Anhui Tatfook Technology's earnings, revenue and cash flow.Do Revenue Forecasts Match The Low P/S Ratio?
Anhui Tatfook Technology's P/S ratio would be typical for a company that's only expected to deliver limited growth, and importantly, perform worse than the industry.
Retrospectively, the last year delivered a frustrating 12% decrease to the company's top line. This has soured the latest three-year period, which nevertheless managed to deliver a decent 9.7% overall rise in revenue. Although it's been a bumpy ride, it's still fair to say the revenue growth recently has been mostly respectable for the company.
This is in contrast to the rest of the industry, which is expected to grow by 51% over the next year, materially higher than the company's recent medium-term annualised growth rates.
With this information, we can see why Anhui Tatfook Technology is trading at a P/S lower than the industry. Apparently many shareholders weren't comfortable holding on to something they believe will continue to trail the wider industry.
The Final Word
Despite Anhui Tatfook Technology's share price climbing recently, its P/S still lags most other companies. We'd say the price-to-sales ratio's power isn't primarily as a valuation instrument but rather to gauge current investor sentiment and future expectations.
Our examination of Anhui Tatfook Technology confirms that the company's revenue trends over the past three-year years are a key factor in its low price-to-sales ratio, as we suspected, given they fall short of current industry expectations. Right now shareholders are accepting the low P/S as they concede future revenue probably won't provide any pleasant surprises. Unless the recent medium-term conditions improve, they will continue to form a barrier for the share price around these levels.
The company's balance sheet is another key area for risk analysis. Take a look at our free balance sheet analysis for Anhui Tatfook Technology with six simple checks on some of these key factors.
If companies with solid past earnings growth is up your alley, you may wish to see this free collection of other companies with strong earnings growth and low P/E ratios.
New: Manage All Your Stock Portfolios in One Place
We've created the ultimate portfolio companion for stock investors, and it's free.
• Connect an unlimited number of Portfolios and see your total in one currency
• Be alerted to new Warning Signs or Risks via email or mobile
• Track the Fair Value of your stocks
Have feedback on this article? Concerned about the content? Get in touch with us directly. Alternatively, email editorial-team (at) simplywallst.com.
This article by Simply Wall St is general in nature. We provide commentary based on historical data and analyst forecasts only using an unbiased methodology and our articles are not intended to be financial advice. It does not constitute a recommendation to buy or sell any stock, and does not take account of your objectives, or your financial situation. We aim to bring you long-term focused analysis driven by fundamental data. Note that our analysis may not factor in the latest price-sensitive company announcements or qualitative material. Simply Wall St has no position in any stocks mentioned.
About SZSE:300134
Anhui Tatfook Technology
Engages in the mobile communication equipment business and other businesses in the People's Republic of China and internationally.
Excellent balance sheet and slightly overvalued.
Market Insights

Advertisement
Community Narratives
Finding The True Value Of A Logistics Powerhouse
Fair Value US$95.21|7.5% undervalued
NV
Community Contributor
Paradigm Biopharmaceuticals Will Lead Osteoarthritis Treatment with Zilosul's FDA Success
Fair Value AU$5.50|91.8% undervalued
AM
Community Contributor
Barrick Mining (ABX:CA): A Gold Hedge against a U.S. Shutdown
Fair Value CA$60.00|26.4% undervalued
GM
Community Contributor