
Advertisement
- China
- /
- Electronic Equipment and Components
- /
- SZSE:002636
Goldenmax International Group Ltd. (SZSE:002636) Stock Catapults 41% Though Its Price And Business Still Lag The Industry
Goldenmax International Group Ltd. (SZSE:002636) shareholders are no doubt pleased to see that the share price has bounced 41% in the last month, although it is still struggling to make up recently lost ground. Not all shareholders will be feeling jubilant, since the share price is still down a very disappointing 25% in the last twelve months.
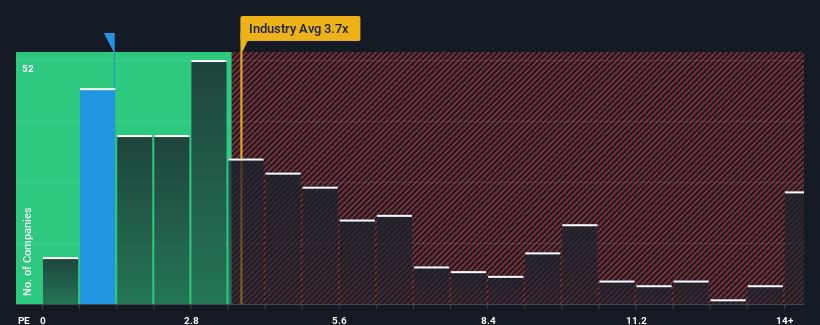
Although its price has surged higher, Goldenmax International Group may still look like a strong buying opportunity at present with its price-to-sales (or "P/S") ratio of 1.3x, considering almost half of all companies in the Electronic industry in China have P/S ratios greater than 3.7x and even P/S higher than 7x aren't out of the ordinary. Although, it's not wise to just take the P/S at face value as there may be an explanation why it's so limited.
Check out our latest analysis for Goldenmax International Group
How Goldenmax International Group Has Been Performing
For example, consider that Goldenmax International Group's financial performance has been poor lately as its revenue has been in decline. One possibility is that the P/S is low because investors think the company won't do enough to avoid underperforming the broader industry in the near future. If you like the company, you'd be hoping this isn't the case so that you could potentially pick up some stock while it's out of favour.
Want the full picture on earnings, revenue and cash flow for the company? Then our free report on Goldenmax International Group will help you shine a light on its historical performance.How Is Goldenmax International Group's Revenue Growth Trending?
The only time you'd be truly comfortable seeing a P/S as depressed as Goldenmax International Group's is when the company's growth is on track to lag the industry decidedly.
Taking a look back first, the company's revenue growth last year wasn't something to get excited about as it posted a disappointing decline of 11%. Regardless, revenue has managed to lift by a handy 8.1% in aggregate from three years ago, thanks to the earlier period of growth. Although it's been a bumpy ride, it's still fair to say the revenue growth recently has been mostly respectable for the company.
Comparing the recent medium-term revenue trends against the industry's one-year growth forecast of 25% shows it's noticeably less attractive.
With this information, we can see why Goldenmax International Group is trading at a P/S lower than the industry. It seems most investors are expecting to see the recent limited growth rates continue into the future and are only willing to pay a reduced amount for the stock.
The Final Word
Shares in Goldenmax International Group have risen appreciably however, its P/S is still subdued. It's argued the price-to-sales ratio is an inferior measure of value within certain industries, but it can be a powerful business sentiment indicator.
Our examination of Goldenmax International Group confirms that the company's revenue trends over the past three-year years are a key factor in its low price-to-sales ratio, as we suspected, given they fall short of current industry expectations. At this stage investors feel the potential for an improvement in revenue isn't great enough to justify a higher P/S ratio. If recent medium-term revenue trends continue, it's hard to see the share price experience a reversal of fortunes anytime soon.
And what about other risks? Every company has them, and we've spotted 3 warning signs for Goldenmax International Group (of which 2 shouldn't be ignored!) you should know about.
If companies with solid past earnings growth is up your alley, you may wish to see this free collection of other companies with strong earnings growth and low P/E ratios.
New: Manage All Your Stock Portfolios in One Place
We've created the ultimate portfolio companion for stock investors, and it's free.
• Connect an unlimited number of Portfolios and see your total in one currency
• Be alerted to new Warning Signs or Risks via email or mobile
• Track the Fair Value of your stocks
Have feedback on this article? Concerned about the content? Get in touch with us directly. Alternatively, email editorial-team (at) simplywallst.com.
This article by Simply Wall St is general in nature. We provide commentary based on historical data and analyst forecasts only using an unbiased methodology and our articles are not intended to be financial advice. It does not constitute a recommendation to buy or sell any stock, and does not take account of your objectives, or your financial situation. We aim to bring you long-term focused analysis driven by fundamental data. Note that our analysis may not factor in the latest price-sensitive company announcements or qualitative material. Simply Wall St has no position in any stocks mentioned.
About SZSE:002636
Goldenmax International Group
Produces and sells basic materials for the electronics industry under the Jin’an brand in China and internationally.
Excellent balance sheet with slight risk.
Market Insights

Advertisement
Community Narratives
The "Molecular Pencil": Why Beam's Technology is Built to Win
Fair Value US$65.01|65.4% undervalued
DA
Community Contributor
The silent giant behind virtually every advanced chip powering AI, smartphones, and modern infrastructure.
Fair Value US$310.00|6.1% undervalued
OS
Community Contributor
ADP Stock: Solid Fundamentals, But AI Investments Test Its Margin Resilience
Fair Value US$387.77|34.2% undervalued
YI
Community Contributor
MINISO's fair value is projected at 26.69 with an anticipated PE ratio shift of 20x
Fair Value US$24.03|9.6% undervalued
BE
Community Contributor