
Advertisement
- China
- /
- Electronic Equipment and Components
- /
- SHSE:688522
Naruida Technology Co., Ltd.'s (SHSE:688522) 30% Share Price Surge Not Quite Adding Up
Naruida Technology Co., Ltd. (SHSE:688522) shareholders are no doubt pleased to see that the share price has bounced 30% in the last month, although it is still struggling to make up recently lost ground. Not all shareholders will be feeling jubilant, since the share price is still down a very disappointing 28% in the last twelve months.
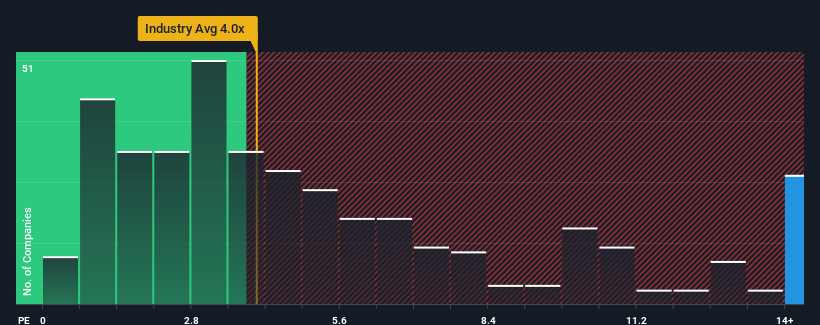
Since its price has surged higher, Naruida Technology may be sending strong sell signals at present with a price-to-sales (or "P/S") ratio of 35.4x, when you consider almost half of the companies in the Electronic industry in China have P/S ratios under 4x and even P/S lower than 2x aren't out of the ordinary. Nonetheless, we'd need to dig a little deeper to determine if there is a rational basis for the highly elevated P/S.
See our latest analysis for Naruida Technology
How Naruida Technology Has Been Performing
For example, consider that Naruida Technology's financial performance has been pretty ordinary lately as revenue growth is non-existent. Perhaps the market believes that revenue growth will improve markedly over current levels, inflating the P/S ratio. If not, then existing shareholders may be a little nervous about the viability of the share price.
Want the full picture on earnings, revenue and cash flow for the company? Then our free report on Naruida Technology will help you shine a light on its historical performance.What Are Revenue Growth Metrics Telling Us About The High P/S?
There's an inherent assumption that a company should far outperform the industry for P/S ratios like Naruida Technology's to be considered reasonable.
If we review the last year of revenue, the company posted a result that saw barely any deviation from a year ago. Although pleasingly revenue has lifted 62% in aggregate from three years ago, notwithstanding the last 12 months. Accordingly, shareholders will be pleased, but also have some questions to ponder about the last 12 months.
Comparing the recent medium-term revenue trends against the industry's one-year growth forecast of 25% shows it's noticeably less attractive.
With this information, we find it concerning that Naruida Technology is trading at a P/S higher than the industry. Apparently many investors in the company are way more bullish than recent times would indicate and aren't willing to let go of their stock at any price. There's a good chance existing shareholders are setting themselves up for future disappointment if the P/S falls to levels more in line with recent growth rates.
The Final Word
Naruida Technology's P/S has grown nicely over the last month thanks to a handy boost in the share price. Generally, our preference is to limit the use of the price-to-sales ratio to establishing what the market thinks about the overall health of a company.
The fact that Naruida Technology currently trades on a higher P/S relative to the industry is an oddity, since its recent three-year growth is lower than the wider industry forecast. When we observe slower-than-industry revenue growth alongside a high P/S ratio, we assume there to be a significant risk of the share price decreasing, which would result in a lower P/S ratio. If recent medium-term revenue trends continue, it will place shareholders' investments at significant risk and potential investors in danger of paying an excessive premium.
You always need to take note of risks, for example - Naruida Technology has 2 warning signs we think you should be aware of.
Of course, profitable companies with a history of great earnings growth are generally safer bets. So you may wish to see this free collection of other companies that have reasonable P/E ratios and have grown earnings strongly.
Valuation is complex, but we're here to simplify it.
Discover if Naruida Technology might be undervalued or overvalued with our detailed analysis, featuring fair value estimates, potential risks, dividends, insider trades, and its financial condition.
Access Free AnalysisHave feedback on this article? Concerned about the content? Get in touch with us directly. Alternatively, email editorial-team (at) simplywallst.com.
This article by Simply Wall St is general in nature. We provide commentary based on historical data and analyst forecasts only using an unbiased methodology and our articles are not intended to be financial advice. It does not constitute a recommendation to buy or sell any stock, and does not take account of your objectives, or your financial situation. We aim to bring you long-term focused analysis driven by fundamental data. Note that our analysis may not factor in the latest price-sensitive company announcements or qualitative material. Simply Wall St has no position in any stocks mentioned.
About SHSE:688522
Naruida Technology
Manufactures and sells polarized multifunctional active phased array radars in China.
Exceptional growth potential with flawless balance sheet.
Market Insights

Advertisement
Community Narratives
Kodiak AI - a potential 100 bagger opportunity?
Fair Value US$14.00|44.7% undervalued
DA
Community Contributor
A Fair Price for a Great Business Facing Real Threats
Fair Value US$383.06|13.0% undervalued
IM
Community Contributor
AXON And Shopify Integration Will Unlock Global Mobile Advertising
Fair Value US$646.30|7.3% undervalued
AN
Based on Analyst Price Targets