- China
- /
- Electronic Equipment and Components
- /
- SHSE:688519
Nanya New Material Technology Co.,Ltd's (SHSE:688519) Shares Bounce 39% But Its Business Still Trails The Industry

Those holding Nanya New Material Technology Co.,Ltd (SHSE:688519) shares would be relieved that the share price has rebounded 39% in the last thirty days, but it needs to keep going to repair the recent damage it has caused to investor portfolios. Unfortunately, the gains of the last month did little to right the losses of the last year with the stock still down 28% over that time.
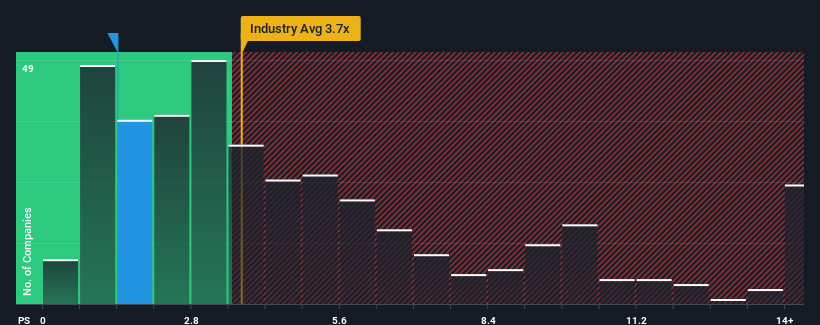
Although its price has surged higher, Nanya New Material TechnologyLtd's price-to-sales (or "P/S") ratio of 1.4x might still make it look like a strong buy right now compared to the wider Electronic industry in China, where around half of the companies have P/S ratios above 3.7x and even P/S above 7x are quite common. Nonetheless, we'd need to dig a little deeper to determine if there is a rational basis for the highly reduced P/S.
Check out our latest analysis for Nanya New Material TechnologyLtd
How Nanya New Material TechnologyLtd Has Been Performing
As an illustration, revenue has deteriorated at Nanya New Material TechnologyLtd over the last year, which is not ideal at all. It might be that many expect the disappointing revenue performance to continue or accelerate, which has repressed the P/S. If you like the company, you'd be hoping this isn't the case so that you could potentially pick up some stock while it's out of favour.
We don't have analyst forecasts, but you can see how recent trends are setting up the company for the future by checking out our free report on Nanya New Material TechnologyLtd's earnings, revenue and cash flow.How Is Nanya New Material TechnologyLtd's Revenue Growth Trending?
There's an inherent assumption that a company should far underperform the industry for P/S ratios like Nanya New Material TechnologyLtd's to be considered reasonable.
Taking a look back first, the company's revenue growth last year wasn't something to get excited about as it posted a disappointing decline of 21%. Still, the latest three year period has seen an excellent 41% overall rise in revenue, in spite of its unsatisfying short-term performance. Accordingly, while they would have preferred to keep the run going, shareholders would definitely welcome the medium-term rates of revenue growth.
Comparing the recent medium-term revenue trends against the industry's one-year growth forecast of 25% shows it's noticeably less attractive.
With this in consideration, it's easy to understand why Nanya New Material TechnologyLtd's P/S falls short of the mark set by its industry peers. Apparently many shareholders weren't comfortable holding on to something they believe will continue to trail the wider industry.
What Does Nanya New Material TechnologyLtd's P/S Mean For Investors?
Even after such a strong price move, Nanya New Material TechnologyLtd's P/S still trails the rest of the industry. While the price-to-sales ratio shouldn't be the defining factor in whether you buy a stock or not, it's quite a capable barometer of revenue expectations.
As we suspected, our examination of Nanya New Material TechnologyLtd revealed its three-year revenue trends are contributing to its low P/S, given they look worse than current industry expectations. Right now shareholders are accepting the low P/S as they concede future revenue probably won't provide any pleasant surprises. If recent medium-term revenue trends continue, it's hard to see the share price experience a reversal of fortunes anytime soon.
Before you take the next step, you should know about the 4 warning signs for Nanya New Material TechnologyLtd (2 are significant!) that we have uncovered.
If strong companies turning a profit tickle your fancy, then you'll want to check out this free list of interesting companies that trade on a low P/E (but have proven they can grow earnings).
Mobile Infrastructure for Defense and Disaster
The next wave in robotics isn't humanoid. Its fully autonomous towers delivering 5G, ISR, and radar in under 30 minutes, anywhere.
Get the investor briefing before the next round of contracts
Sponsored On Behalf of CiTechValuation is complex, but we're here to simplify it.
Discover if Nanya New Material TechnologyLtd might be undervalued or overvalued with our detailed analysis, featuring fair value estimates, potential risks, dividends, insider trades, and its financial condition.
Access Free AnalysisHave feedback on this article? Concerned about the content? Get in touch with us directly. Alternatively, email editorial-team (at) simplywallst.com.
This article by Simply Wall St is general in nature. We provide commentary based on historical data and analyst forecasts only using an unbiased methodology and our articles are not intended to be financial advice. It does not constitute a recommendation to buy or sell any stock, and does not take account of your objectives, or your financial situation. We aim to bring you long-term focused analysis driven by fundamental data. Note that our analysis may not factor in the latest price-sensitive company announcements or qualitative material. Simply Wall St has no position in any stocks mentioned.
About SHSE:688519
Nanya New Material TechnologyLtd
Engages in the design, research and development, production, and sales of composite materials in China and internationally.
High growth potential with excellent balance sheet.
Market Insights

Weekly Picks

Early mover in a fast growing industry. Likely to experience share price volatility as they scale


A case for CA$31.80 (undiluted), aka 8,616% upside from CA$0.37 (an 86 bagger!).


Moderation and Stabilisation: HOLD: Fair Price based on a 4-year Cycle is $12.08
Recently Updated Narratives


Positioned to Win as the Streaming Wars Settle

Meta’s Bold Bet on AI Pays Off

ADP Stock: Solid Fundamentals, But AI Investments Test Its Margin Resilience
Popular Narratives


Crazy Undervalued 42 Baggers Silver Play (Active & Running Mine)


NVDA: Expanding AI Demand Will Drive Major Data Center Investments Through 2026

The AI Infrastructure Giant Grows Into Its Valuation
Trending Discussion

