
Advertisement
- China
- /
- Electronic Equipment and Components
- /
- SHSE:688183
Shengyi Electronics Co., Ltd. (SHSE:688183) Surges 34% Yet Its Low P/S Is No Reason For Excitement

Those holding Shengyi Electronics Co., Ltd. (SHSE:688183) shares would be relieved that the share price has rebounded 34% in the last thirty days, but it needs to keep going to repair the recent damage it has caused to investor portfolios. Unfortunately, the gains of the last month did little to right the losses of the last year with the stock still down 28% over that time.
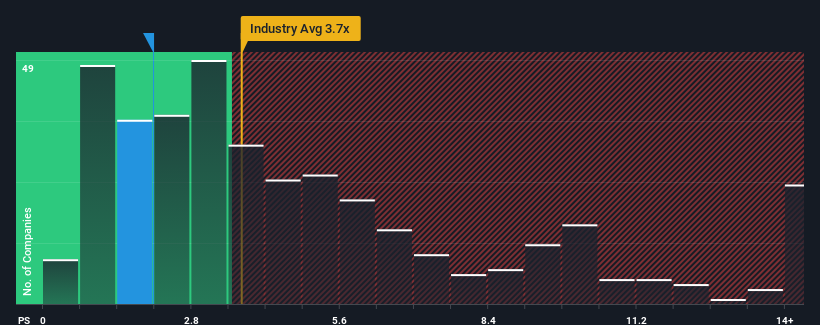
Even after such a large jump in price, Shengyi Electronics may still be sending bullish signals at the moment with its price-to-sales (or "P/S") ratio of 2.1x, since almost half of all companies in the Electronic industry in China have P/S ratios greater than 3.7x and even P/S higher than 7x are not unusual. However, the P/S might be low for a reason and it requires further investigation to determine if it's justified.
See our latest analysis for Shengyi Electronics
How Has Shengyi Electronics Performed Recently?
For instance, Shengyi Electronics' receding revenue in recent times would have to be some food for thought. One possibility is that the P/S is low because investors think the company won't do enough to avoid underperforming the broader industry in the near future. If you like the company, you'd be hoping this isn't the case so that you could potentially pick up some stock while it's out of favour.
Although there are no analyst estimates available for Shengyi Electronics, take a look at this free data-rich visualisation to see how the company stacks up on earnings, revenue and cash flow.Do Revenue Forecasts Match The Low P/S Ratio?
In order to justify its P/S ratio, Shengyi Electronics would need to produce sluggish growth that's trailing the industry.
In reviewing the last year of financials, we were disheartened to see the company's revenues fell to the tune of 7.4%. This means it has also seen a slide in revenue over the longer-term as revenue is down 9.9% in total over the last three years. So unfortunately, we have to acknowledge that the company has not done a great job of growing revenue over that time.
In contrast to the company, the rest of the industry is expected to grow by 25% over the next year, which really puts the company's recent medium-term revenue decline into perspective.
In light of this, it's understandable that Shengyi Electronics' P/S would sit below the majority of other companies. Nonetheless, there's no guarantee the P/S has reached a floor yet with revenue going in reverse. There's potential for the P/S to fall to even lower levels if the company doesn't improve its top-line growth.
What We Can Learn From Shengyi Electronics' P/S?
Shengyi Electronics' stock price has surged recently, but its but its P/S still remains modest. We'd say the price-to-sales ratio's power isn't primarily as a valuation instrument but rather to gauge current investor sentiment and future expectations.
It's no surprise that Shengyi Electronics maintains its low P/S off the back of its sliding revenue over the medium-term. Right now shareholders are accepting the low P/S as they concede future revenue probably won't provide any pleasant surprises either. Unless the recent medium-term conditions improve, they will continue to form a barrier for the share price around these levels.
Plus, you should also learn about these 2 warning signs we've spotted with Shengyi Electronics.
It's important to make sure you look for a great company, not just the first idea you come across. So if growing profitability aligns with your idea of a great company, take a peek at this free list of interesting companies with strong recent earnings growth (and a low P/E).
New: Manage All Your Stock Portfolios in One Place
We've created the ultimate portfolio companion for stock investors, and it's free.
• Connect an unlimited number of Portfolios and see your total in one currency
• Be alerted to new Warning Signs or Risks via email or mobile
• Track the Fair Value of your stocks
Have feedback on this article? Concerned about the content? Get in touch with us directly. Alternatively, email editorial-team (at) simplywallst.com.
This article by Simply Wall St is general in nature. We provide commentary based on historical data and analyst forecasts only using an unbiased methodology and our articles are not intended to be financial advice. It does not constitute a recommendation to buy or sell any stock, and does not take account of your objectives, or your financial situation. We aim to bring you long-term focused analysis driven by fundamental data. Note that our analysis may not factor in the latest price-sensitive company announcements or qualitative material. Simply Wall St has no position in any stocks mentioned.
About SHSE:688183
Shengyi Electronics
Engages in the research and development, production, and sales of various printed circuit boards in China.
Exceptional growth potential with flawless balance sheet.
Market Insights

Advertisement
Community Narratives
Pinterest will surge as advertising innovations ignite revenue growth
Fair Value US$42.63|27.0% undervalued
BR
Community Contributor
Brambles' Revenue Set to Climb 14% with Profit Margins Following
Fair Value AU$21.90|5.9% overvalued
RO
Community Contributor
Challenging Future for STG as Organic Sales Decline by 8.8%
Fair Value DKK 116.13|26.8% undervalued
KA
Community Contributor