- China
- /
- Electronic Equipment and Components
- /
- SHSE:688002
Returns On Capital Signal Tricky Times Ahead For Raytron TechnologyLtd (SHSE:688002)

To find a multi-bagger stock, what are the underlying trends we should look for in a business? Firstly, we'd want to identify a growing return on capital employed (ROCE) and then alongside that, an ever-increasing base of capital employed. If you see this, it typically means it's a company with a great business model and plenty of profitable reinvestment opportunities. Having said that, from a first glance at Raytron TechnologyLtd (SHSE:688002) we aren't jumping out of our chairs at how returns are trending, but let's have a deeper look.
Understanding Return On Capital Employed (ROCE)
For those that aren't sure what ROCE is, it measures the amount of pre-tax profits a company can generate from the capital employed in its business. To calculate this metric for Raytron TechnologyLtd, this is the formula:
Return on Capital Employed = Earnings Before Interest and Tax (EBIT) ÷ (Total Assets - Current Liabilities)
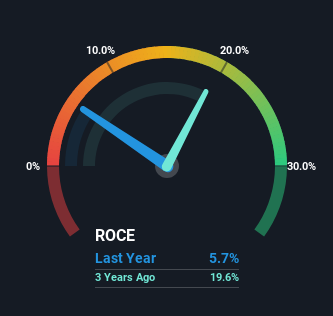
0.057 = CN¥386m ÷ (CN¥8.7b - CN¥1.9b) (Based on the trailing twelve months to March 2024).
So, Raytron TechnologyLtd has an ROCE of 5.7%. On its own, that's a low figure but it's around the 5.2% average generated by the Electronic industry.
See our latest analysis for Raytron TechnologyLtd
Above you can see how the current ROCE for Raytron TechnologyLtd compares to its prior returns on capital, but there's only so much you can tell from the past. If you'd like, you can check out the forecasts from the analysts covering Raytron TechnologyLtd for free.
How Are Returns Trending?
On the surface, the trend of ROCE at Raytron TechnologyLtd doesn't inspire confidence. Around five years ago the returns on capital were 12%, but since then they've fallen to 5.7%. However, given capital employed and revenue have both increased it appears that the business is currently pursuing growth, at the consequence of short term returns. If these investments prove successful, this can bode very well for long term stock performance.
On a side note, Raytron TechnologyLtd's current liabilities have increased over the last five years to 22% of total assets, effectively distorting the ROCE to some degree. Without this increase, it's likely that ROCE would be even lower than 5.7%. Keep an eye on this ratio, because the business could encounter some new risks if this metric gets too high.
The Bottom Line
In summary, despite lower returns in the short term, we're encouraged to see that Raytron TechnologyLtd is reinvesting for growth and has higher sales as a result. These growth trends haven't led to growth returns though, since the stock has fallen 51% over the last five years. So we think it'd be worthwhile to look further into this stock given the trends look encouraging.
If you're still interested in Raytron TechnologyLtd it's worth checking out our FREE intrinsic value approximation for 688002 to see if it's trading at an attractive price in other respects.
If you want to search for solid companies with great earnings, check out this free list of companies with good balance sheets and impressive returns on equity.
The New Payments ETF Is Live on NASDAQ:
Money is moving to real-time rails, and a newly listed ETF now gives investors direct exposure. Fast settlement. Institutional custody. Simple access.
Explore how this launch could reshape portfolios
Sponsored ContentNew: AI Stock Screener & Alerts
Our new AI Stock Screener scans the market every day to uncover opportunities.
• Dividend Powerhouses (3%+ Yield)
• Undervalued Small Caps with Insider Buying
• High growth Tech and AI Companies
Or build your own from over 50 metrics.
Have feedback on this article? Concerned about the content? Get in touch with us directly. Alternatively, email editorial-team (at) simplywallst.com.
This article by Simply Wall St is general in nature. We provide commentary based on historical data and analyst forecasts only using an unbiased methodology and our articles are not intended to be financial advice. It does not constitute a recommendation to buy or sell any stock, and does not take account of your objectives, or your financial situation. We aim to bring you long-term focused analysis driven by fundamental data. Note that our analysis may not factor in the latest price-sensitive company announcements or qualitative material. Simply Wall St has no position in any stocks mentioned.
About SHSE:688002
Raytron TechnologyLtd
Engages in the research and development, design, manufacturing, and sales of uncooled infrared imagining, MEMS sensor, and image processing algorithms technology in China.
Solid track record with excellent balance sheet.
Market Insights

Weekly Picks

Early mover in a fast growing industry. Likely to experience share price volatility as they scale


A case for CA$31.80 (undiluted), aka 8,616% upside from CA$0.37 (an 86 bagger!).


Moderation and Stabilisation: HOLD: Fair Price based on a 4-year Cycle is $12.08
Recently Updated Narratives

Airbnb Stock: Platform Growth in a World of Saturation and Scrutiny

Clarivate Stock: When Data Becomes the Backbone of Innovation and Law

Adobe Stock: AI-Fueled ARR Growth Pushes Guidance Higher, But Cost Pressures Loom
Popular Narratives


Crazy Undervalued 42 Baggers Silver Play (Active & Running Mine)


NVDA: Expanding AI Demand Will Drive Major Data Center Investments Through 2026


MicroVision will explode future revenue by 380.37% with a vision towards success
Trending Discussion
