Advertisement
- Japan
- /
- Healthtech
- /
- TSE:4480
High Growth Tech Stocks in Asia to Watch This July 2025

Simply Wall St
Reviewed by Simply Wall St

As global markets navigate the complexities of new tariffs and mixed economic signals, Asian tech stocks continue to capture investor interest with their potential for high growth. In this dynamic environment, identifying promising stocks involves looking at companies that can effectively leverage technological innovation and adapt to shifting trade landscapes.
Top 10 High Growth Tech Companies In Asia
| Name | Revenue Growth | Earnings Growth | Growth Rating |
|---|---|---|---|
| Suzhou TFC Optical Communication | 30.19% | 29.63% | ★★★★★★ |
| Shengyi Electronics | 22.99% | 35.16% | ★★★★★★ |
| Shanghai Huace Navigation Technology | 24.44% | 23.48% | ★★★★★★ |
| Fositek | 28.51% | 35.31% | ★★★★★★ |
| PharmaResearch | 26.50% | 29.34% | ★★★★★★ |
| eWeLLLtd | 24.95% | 24.40% | ★★★★★★ |
| Global Security Experts | 20.56% | 28.04% | ★★★★★★ |
| Marketingforce Management | 26.39% | 112.30% | ★★★★★★ |
| CARsgen Therapeutics Holdings | 81.53% | 96.08% | ★★★★★★ |
| JNTC | 55.45% | 94.52% | ★★★★★★ |
Let's dive into some prime choices out of from the screener.
Q Technology (Group) (SEHK:1478)
Simply Wall St Growth Rating: ★★★★☆☆
Overview: Q Technology (Group) Company Limited is an investment holding company involved in the design, research and development, manufacturing, and sale of camera and fingerprint recognition modules across Mainland China, Hong Kong, India, and internationally with a market capitalization of HK$12.93 billion.
Operations: Q Technology (Group) focuses on the design, R&D, manufacturing, and sale of camera and fingerprint recognition modules. The company generates significant revenue from camera modules at CN¥14.83 billion and also earns from fingerprint recognition modules with CN¥1.18 billion in revenue.
Q Technology (Group) is capitalizing on the robust demand for advanced camera and fingerprint modules, crucial for smartphones and IoT applications. With an impressive 240.7% earnings growth surpassing the industry's 14.1%, and a significant forecasted annual profit growth of 22.2%, the company is well-positioned in high-tech markets. Recent corporate guidance predicts a substantial profit increase by up to 180% due to higher sales volumes in both automotive camera modules and fingerprint products, which also boosted their gross margin significantly. This performance underscores Q Technology's strategic focus on high-value segments, promising continued market relevance amid evolving tech demands.
- Navigate through the intricacies of Q Technology (Group) with our comprehensive health report here.
Explore historical data to track Q Technology (Group)'s performance over time in our Past section.
Beijing Yuanliu Hongyuan Electronic Technology (SHSE:603267)
Simply Wall St Growth Rating: ★★★★★☆
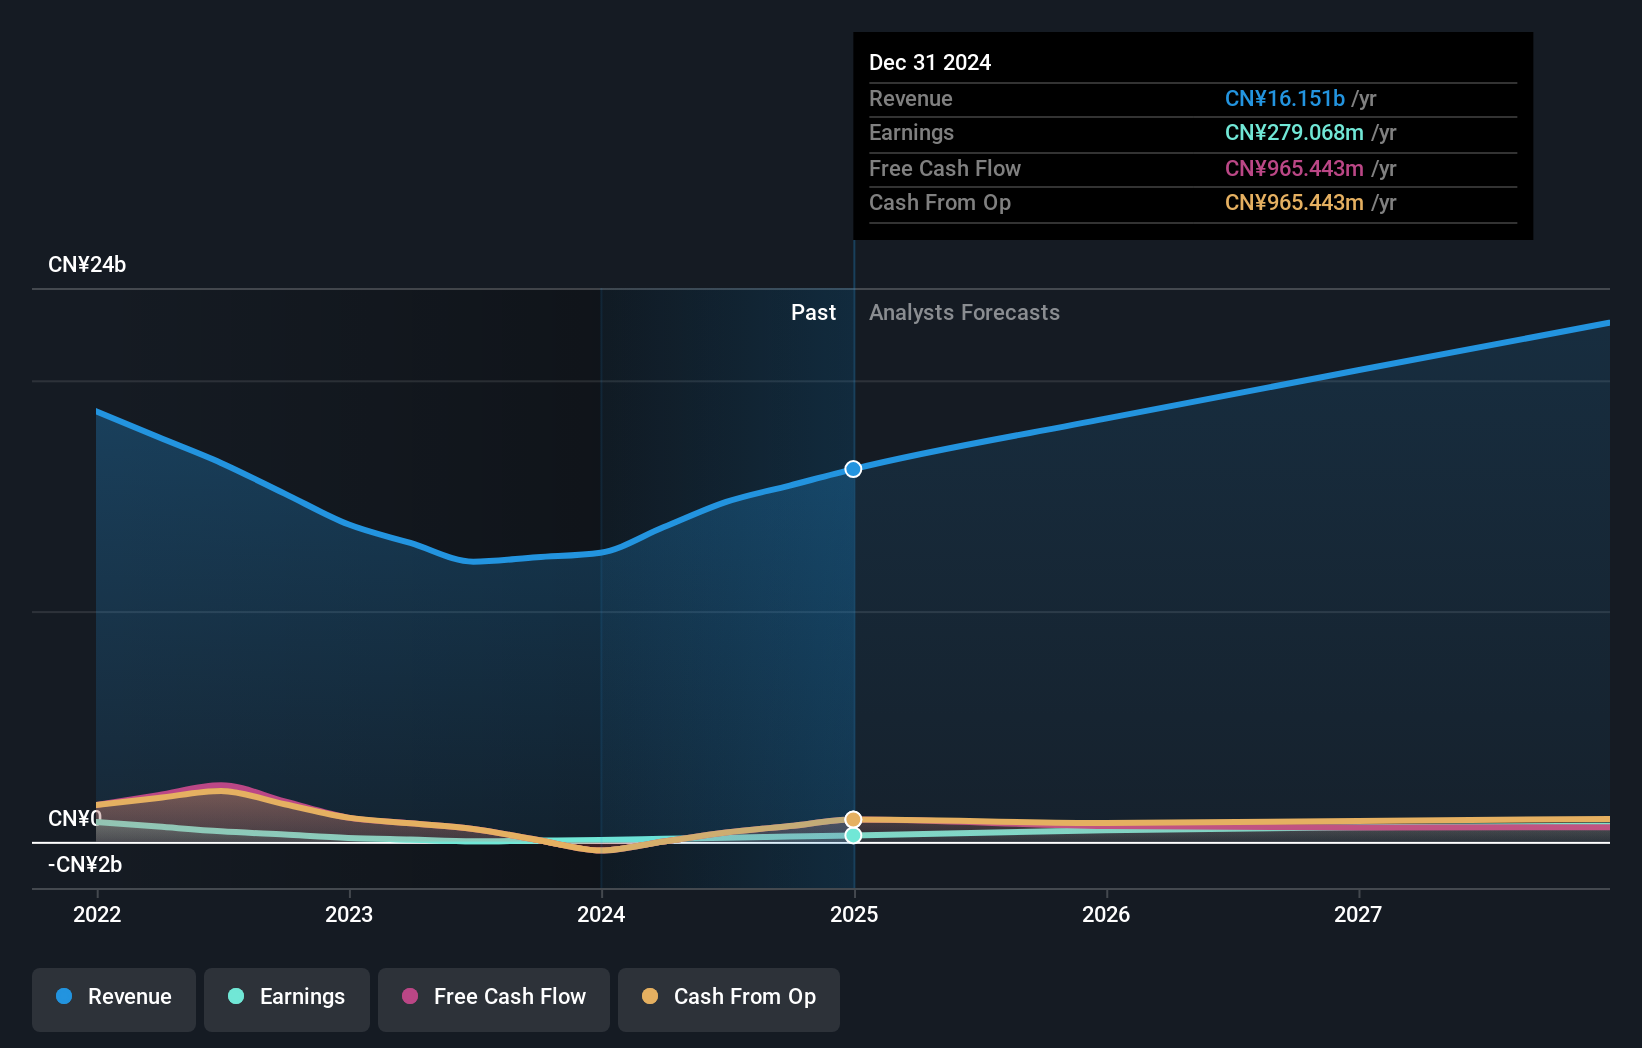
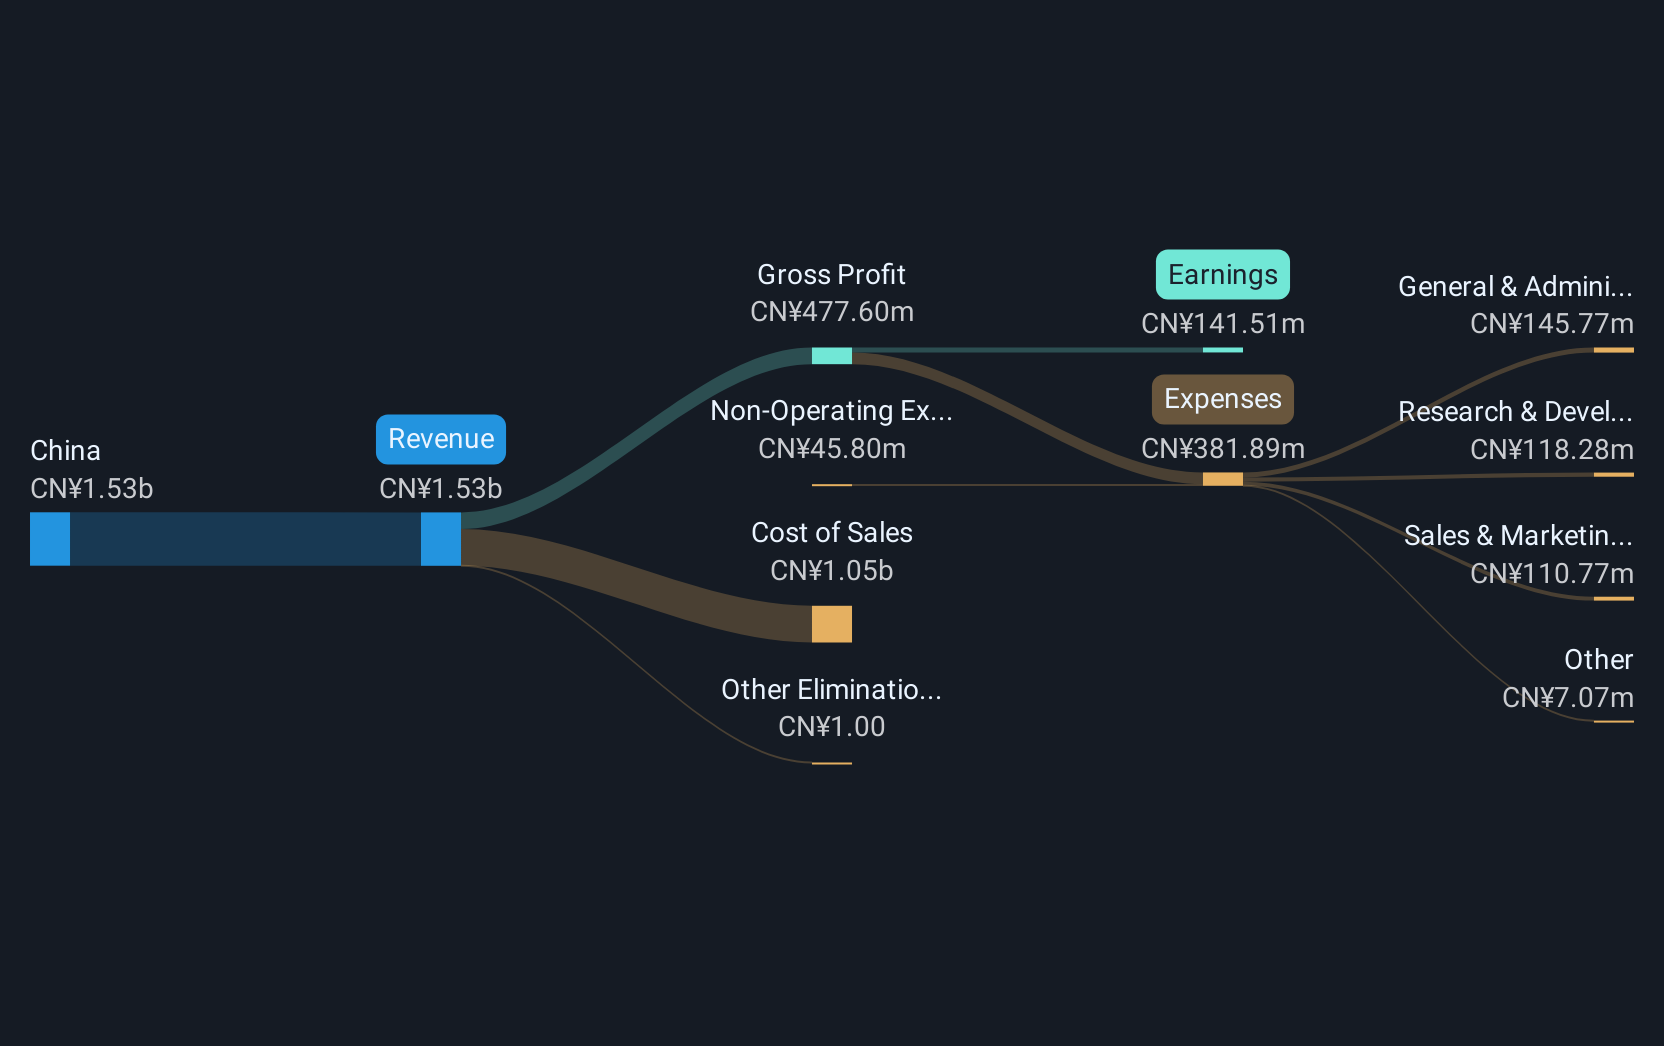
Overview: Beijing Yuanliu Hongyuan Electronic Technology Co., Ltd. operates in the electronic technology sector and has a market capitalization of CN¥11.79 billion.
Operations: Yuanliu Hongyuan Electronic Technology focuses on the electronic technology sector, generating revenue through its specialized products and services. The company's financial performance is highlighted by its market capitalization of CN¥11.79 billion.
Beijing Yuanliu Hongyuan Electronic Technology is navigating a challenging landscape with its recent financial performance reflecting a dip in net income from CNY 72.43 million to CNY 60.2 million, despite an increase in sales to CNY 466.37 million from the previous year's CNY 429.16 million. This contrasts starkly with its robust revenue growth forecast at 27% annually, outpacing the broader Chinese market's growth rate of 12.4%. The company's commitment to innovation is evident from its notable R&D investments, aligning with industry trends towards enhanced technological offerings and efficiency improvements in electronic technologies. However, a significant one-off gain of CN¥51M last year masks underlying earnings quality issues, complicating the financial outlook despite promising top-line growth projections and an anticipated earnings surge of approximately 42.8% per annum over the next three years.
Medley (TSE:4480)
Simply Wall St Growth Rating: ★★★★★☆
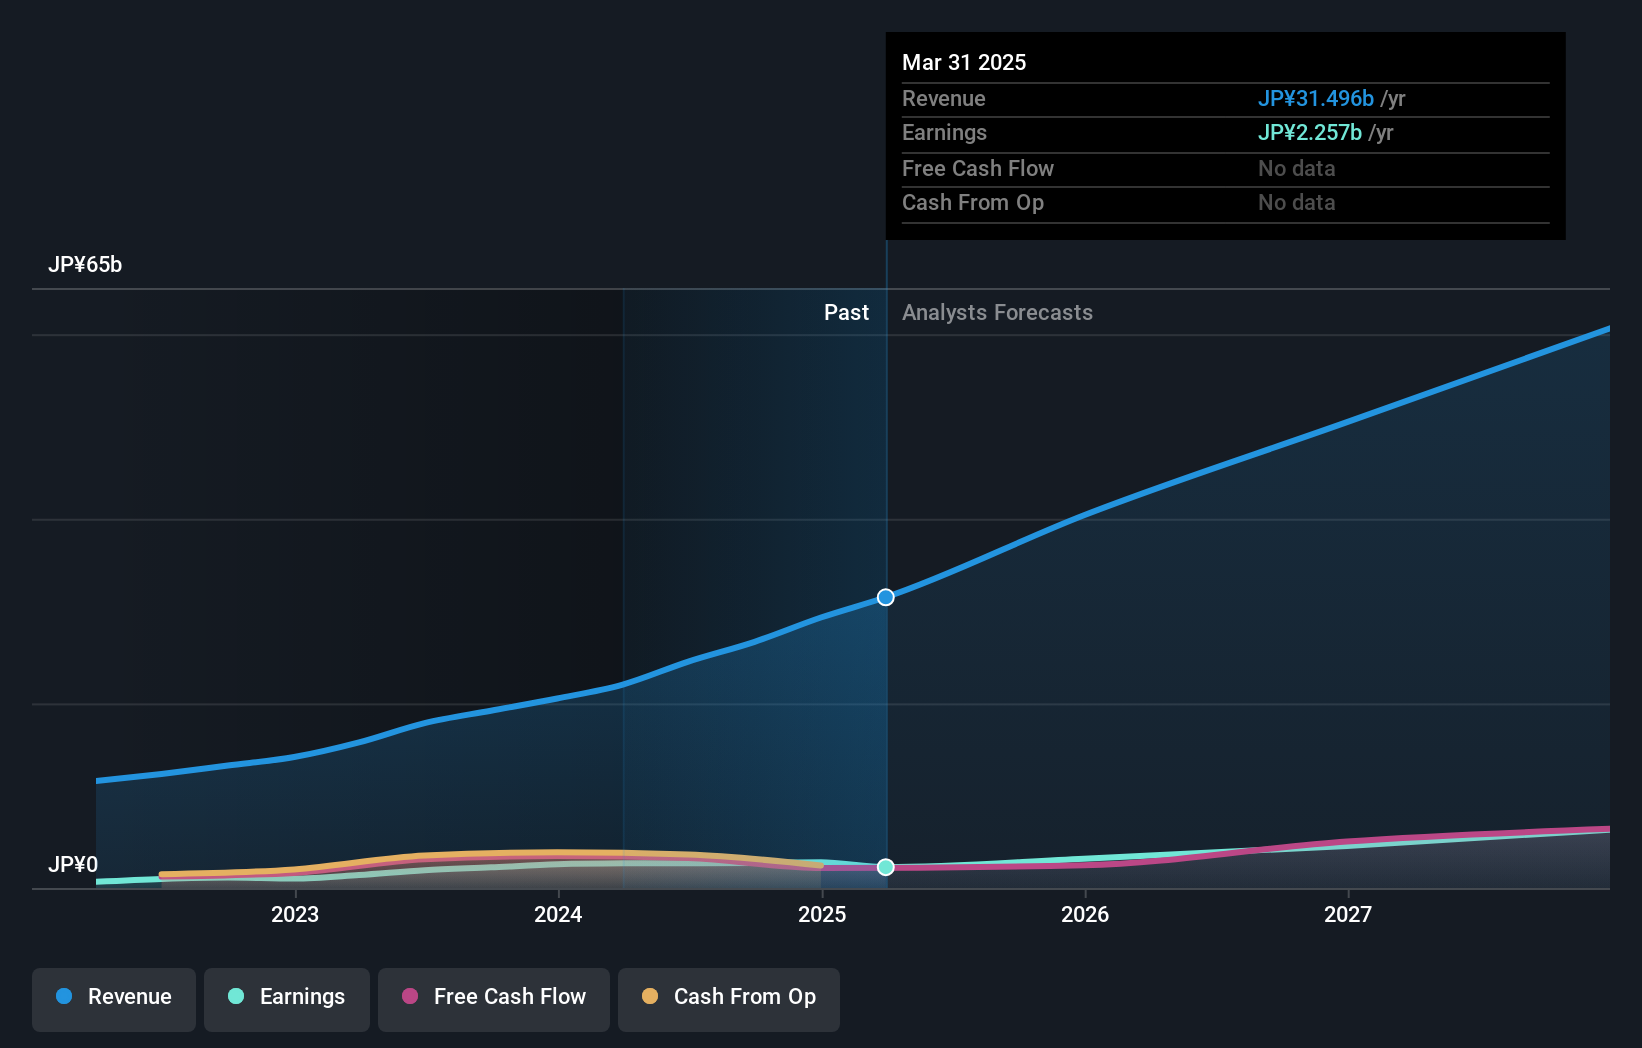
Overview: Medley, Inc. operates recruitment and medical platforms in Japan and the United States, with a market cap of ¥111.10 billion.
Operations: Medley, Inc. generates revenue primarily through its Human Resource Platform Business, contributing ¥22.67 billion, and its Medical Platform Business with ¥7.72 billion. The company also explores new services adding ¥1.11 billion to its revenue streams.
Medley is carving a niche in the high-growth tech sector in Asia, with its strategic emphasis on R&D investment reflecting a robust commitment to innovation. In the last fiscal year, R&D expenses surged to $120 million, accounting for approximately 15% of its total revenue, which aligns with an aggressive push into new markets and technologies. This focus has translated into a notable revenue increase of 17.3% annually and an earnings spike projected at 26.9% per year. Additionally, recent share repurchases totaling $50 million underscore confidence in future growth prospects, further supported by Medley's expanding client base that includes major industry players like TSMC. This strategic positioning is expected to bolster Medley's standing in the competitive tech landscape of Asia.
- Get an in-depth perspective on Medley's performance by reading our health report here.
Understand Medley's track record by examining our Past report.
Taking Advantage
- Click through to start exploring the rest of the 475 Asian High Growth Tech and AI Stocks now.
- Already own these companies? Bring clarity to your investment decisions by linking up your portfolio with Simply Wall St, where you can monitor all the vital signs of your stocks effortlessly.
- Unlock the power of informed investing with Simply Wall St, your free guide to navigating stock markets worldwide.
Searching for a Fresh Perspective?
- Explore high-performing small cap companies that haven't yet garnered significant analyst attention.
- Fuel your portfolio with companies showing strong growth potential, backed by optimistic outlooks both from analysts and management.
- Find companies with promising cash flow potential yet trading below their fair value.
This article by Simply Wall St is general in nature. We provide commentary based on historical data and analyst forecasts only using an unbiased methodology and our articles are not intended to be financial advice. It does not constitute a recommendation to buy or sell any stock, and does not take account of your objectives, or your financial situation. We aim to bring you long-term focused analysis driven by fundamental data. Note that our analysis may not factor in the latest price-sensitive company announcements or qualitative material. Simply Wall St has no position in any stocks mentioned.
New: Manage All Your Stock Portfolios in One Place
We've created the ultimate portfolio companion for stock investors, and it's free.
• Connect an unlimited number of Portfolios and see your total in one currency
• Be alerted to new Warning Signs or Risks via email or mobile
• Track the Fair Value of your stocks
Have feedback on this article? Concerned about the content? Get in touch with us directly. Alternatively, email editorial-team@simplywallst.com
About TSE:4480
Medley
Operates platforms for recruitment and medical businesses in Japan and the United States.
High growth potential with adequate balance sheet.
Market Insights


Advertisement
Community Narratives
For the Emperor: Why Games Workshop Could Be a Star Investment
Fair Value UK£160.00|0.5% overvalued
RO
Community Contributor
Securitas will boost margins with AI and tech-driven services
Fair Value SEK 260.91|44.5% undervalued
UN
Community Contributor
A Leader in EV Charging with Growth Potential
Fair Value €27.00|18.7% undervalued
TI
Community Contributor