- China
- /
- Electronic Equipment and Components
- /
- SHSE:600707
Caihong Display Devices Co.,Ltd.'s (SHSE:600707) Fundamentals Look Pretty Strong: Could The Market Be Wrong About The Stock?

Caihong Display DevicesLtd (SHSE:600707) has had a rough three months with its share price down 15%. However, the company's fundamentals look pretty decent, and long-term financials are usually aligned with future market price movements. Specifically, we decided to study Caihong Display DevicesLtd's ROE in this article.
Return on Equity or ROE is a test of how effectively a company is growing its value and managing investors’ money. In simpler terms, it measures the profitability of a company in relation to shareholder's equity.
View our latest analysis for Caihong Display DevicesLtd
How Is ROE Calculated?
ROE can be calculated by using the formula:
Return on Equity = Net Profit (from continuing operations) ÷ Shareholders' Equity
So, based on the above formula, the ROE for Caihong Display DevicesLtd is:
8.6% = CN¥1.8b ÷ CN¥21b (Based on the trailing twelve months to June 2024).
The 'return' is the yearly profit. That means that for every CN¥1 worth of shareholders' equity, the company generated CN¥0.09 in profit.
What Has ROE Got To Do With Earnings Growth?
We have already established that ROE serves as an efficient profit-generating gauge for a company's future earnings. Depending on how much of these profits the company reinvests or "retains", and how effectively it does so, we are then able to assess a company’s earnings growth potential. Generally speaking, other things being equal, firms with a high return on equity and profit retention, have a higher growth rate than firms that don’t share these attributes.
Caihong Display DevicesLtd's Earnings Growth And 8.6% ROE
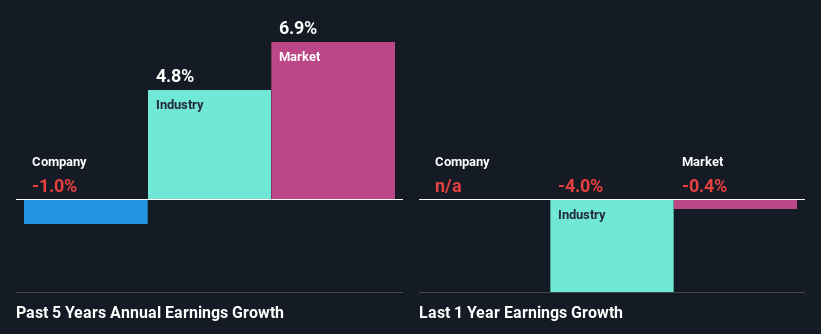
At first glance, Caihong Display DevicesLtd's ROE doesn't look very promising. However, the fact that the its ROE is quite higher to the industry average of 6.4% doesn't go unnoticed by us. However, Caihong Display DevicesLtd has seen a flattish net income growth over the past five years, which is not saying much. Remember, the company's ROE is a bit low to begin with, just that it is higher than the industry average. Hence, this goes some way in explaining the flat earnings growth.
We then compared Caihong Display DevicesLtd's net income growth with the industry and found that the average industry growth rate was 4.8% in the same 5-year period.
The basis for attaching value to a company is, to a great extent, tied to its earnings growth. The investor should try to establish if the expected growth or decline in earnings, whichever the case may be, is priced in. This then helps them determine if the stock is placed for a bright or bleak future. If you're wondering about Caihong Display DevicesLtd's's valuation, check out this gauge of its price-to-earnings ratio, as compared to its industry.
Is Caihong Display DevicesLtd Using Its Retained Earnings Effectively?
Caihong Display DevicesLtd doesn't pay any regular dividends, meaning that the company is keeping all of its profits, which makes us wonder why it is retaining its earnings if it can't use them to grow its business. It looks like there might be some other reasons to explain the lack in that respect. For example, the business could be in decline.
Summary
Overall, we feel that Caihong Display DevicesLtd certainly does have some positive factors to consider. Yet, the low earnings growth is a bit concerning, especially given that the company has a respectable rate of return and is reinvesting a huge portion of its profits. By the looks of it, there could be some other factors, not necessarily in control of the business, that's preventing growth. So far, we've only made a quick discussion around the company's earnings growth. So it may be worth checking this free detailed graph of Caihong Display DevicesLtd's past earnings, as well as revenue and cash flows to get a deeper insight into the company's performance.
Mobile Infrastructure for Defense and Disaster
The next wave in robotics isn't humanoid. Its fully autonomous towers delivering 5G, ISR, and radar in under 30 minutes, anywhere.
Get the investor briefing before the next round of contracts
Sponsored On Behalf of CiTechNew: AI Stock Screener & Alerts
Our new AI Stock Screener scans the market every day to uncover opportunities.
• Dividend Powerhouses (3%+ Yield)
• Undervalued Small Caps with Insider Buying
• High growth Tech and AI Companies
Or build your own from over 50 metrics.
Have feedback on this article? Concerned about the content? Get in touch with us directly. Alternatively, email editorial-team (at) simplywallst.com.
This article by Simply Wall St is general in nature. We provide commentary based on historical data and analyst forecasts only using an unbiased methodology and our articles are not intended to be financial advice. It does not constitute a recommendation to buy or sell any stock, and does not take account of your objectives, or your financial situation. We aim to bring you long-term focused analysis driven by fundamental data. Note that our analysis may not factor in the latest price-sensitive company announcements or qualitative material. Simply Wall St has no position in any stocks mentioned.
About SHSE:600707
Caihong Display DevicesLtd
Engages in the research, development, production, and sale of substrate glass and display panels in China and internationally.
Excellent balance sheet with very low risk.
Market Insights

Weekly Picks

Early mover in a fast growing industry. Likely to experience share price volatility as they scale


A case for CA$31.80 (undiluted), aka 8,616% upside from CA$0.37 (an 86 bagger!).


Moderation and Stabilisation: HOLD: Fair Price based on a 4-year Cycle is $12.08
Recently Updated Narratives

Automotive Electronics Manufacturer Consistent and Stable

Airbnb Stock: Platform Growth in a World of Saturation and Scrutiny

Adobe Stock: AI-Fueled ARR Growth Pushes Guidance Higher, But Cost Pressures Loom
Popular Narratives


Crazy Undervalued 42 Baggers Silver Play (Active & Running Mine)


NVDA: Expanding AI Demand Will Drive Major Data Center Investments Through 2026

The AI Infrastructure Giant Grows Into Its Valuation
Trending Discussion


