- China
- /
- Tech Hardware
- /
- SHSE:600100
Tsinghua Tongfang Co., Ltd. (SHSE:600100) Stock Catapults 28% Though Its Price And Business Still Lag The Industry


Tsinghua Tongfang Co., Ltd. (SHSE:600100) shareholders have had their patience rewarded with a 28% share price jump in the last month. Unfortunately, the gains of the last month did little to right the losses of the last year with the stock still down 13% over that time.
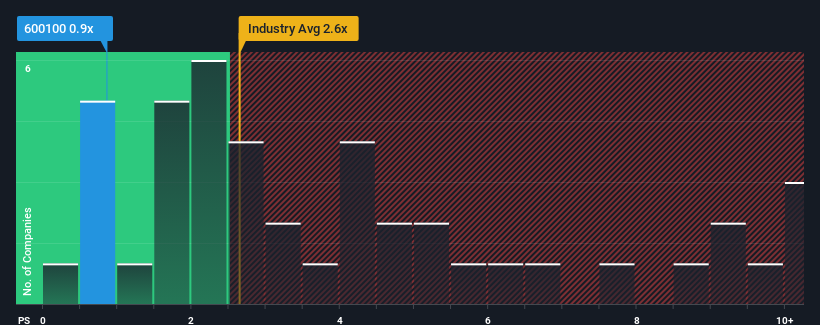
In spite of the firm bounce in price, Tsinghua Tongfang's price-to-sales (or "P/S") ratio of 0.9x might still make it look like a buy right now compared to the Tech industry in China, where around half of the companies have P/S ratios above 2.6x and even P/S above 5x are quite common. Although, it's not wise to just take the P/S at face value as there may be an explanation why it's limited.
Check out our latest analysis for Tsinghua Tongfang
How Tsinghua Tongfang Has Been Performing
For instance, Tsinghua Tongfang's receding revenue in recent times would have to be some food for thought. It might be that many expect the disappointing revenue performance to continue or accelerate, which has repressed the P/S. If you like the company, you'd be hoping this isn't the case so that you could potentially pick up some stock while it's out of favour.
Want the full picture on earnings, revenue and cash flow for the company? Then our free report on Tsinghua Tongfang will help you shine a light on its historical performance.Do Revenue Forecasts Match The Low P/S Ratio?
There's an inherent assumption that a company should underperform the industry for P/S ratios like Tsinghua Tongfang's to be considered reasonable.
In reviewing the last year of financials, we were disheartened to see the company's revenues fell to the tune of 3.8%. This means it has also seen a slide in revenue over the longer-term as revenue is down 16% in total over the last three years. Therefore, it's fair to say the revenue growth recently has been undesirable for the company.
Comparing that to the industry, which is predicted to deliver 17% growth in the next 12 months, the company's downward momentum based on recent medium-term revenue results is a sobering picture.
With this information, we are not surprised that Tsinghua Tongfang is trading at a P/S lower than the industry. Nonetheless, there's no guarantee the P/S has reached a floor yet with revenue going in reverse. Even just maintaining these prices could be difficult to achieve as recent revenue trends are already weighing down the shares.
What We Can Learn From Tsinghua Tongfang's P/S?
Tsinghua Tongfang's stock price has surged recently, but its but its P/S still remains modest. We'd say the price-to-sales ratio's power isn't primarily as a valuation instrument but rather to gauge current investor sentiment and future expectations.
As we suspected, our examination of Tsinghua Tongfang revealed its shrinking revenue over the medium-term is contributing to its low P/S, given the industry is set to grow. Right now shareholders are accepting the low P/S as they concede future revenue probably won't provide any pleasant surprises either. Given the current circumstances, it seems unlikely that the share price will experience any significant movement in either direction in the near future if recent medium-term revenue trends persist.
Many other vital risk factors can be found on the company's balance sheet. You can assess many of the main risks through our free balance sheet analysis for Tsinghua Tongfang with six simple checks.
If strong companies turning a profit tickle your fancy, then you'll want to check out this free list of interesting companies that trade on a low P/E (but have proven they can grow earnings).
Valuation is complex, but we're here to simplify it.
Discover if Tsinghua Tongfang might be undervalued or overvalued with our detailed analysis, featuring fair value estimates, potential risks, dividends, insider trades, and its financial condition.
Access Free AnalysisHave feedback on this article? Concerned about the content? Get in touch with us directly. Alternatively, email editorial-team (at) simplywallst.com.
This article by Simply Wall St is general in nature. We provide commentary based on historical data and analyst forecasts only using an unbiased methodology and our articles are not intended to be financial advice. It does not constitute a recommendation to buy or sell any stock, and does not take account of your objectives, or your financial situation. We aim to bring you long-term focused analysis driven by fundamental data. Note that our analysis may not factor in the latest price-sensitive company announcements or qualitative material. Simply Wall St has no position in any stocks mentioned.
About SHSE:600100
Tsinghua Tongfang
Engages in digital information, civil nuclear technology, energy conservation and environmental protection, and technology and finance businesses.
Excellent balance sheet and fair value.
Similar Companies
Market Insights

Community Narratives


