
Advertisement
Little Excitement Around Beijing Interact Technology Co.,Ltd.'s (SZSE:300419) Revenues As Shares Take 25% Pounding
Beijing Interact Technology Co.,Ltd. (SZSE:300419) shares have retraced a considerable 25% in the last month, reversing a fair amount of their solid recent performance. The drop over the last 30 days has capped off a tough year for shareholders, with the share price down 14% in that time.
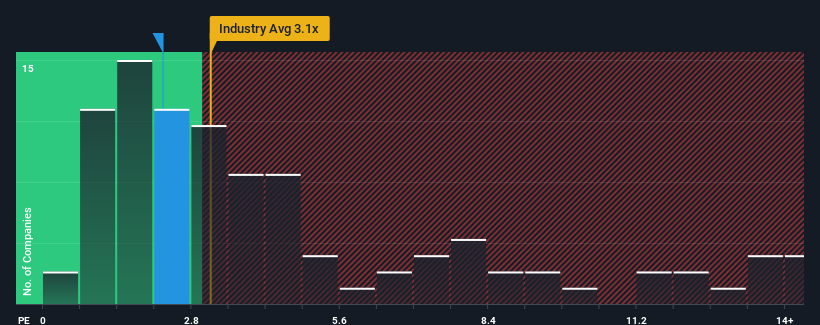
Even after such a large drop in price, Beijing Interact TechnologyLtd may still be sending bullish signals at the moment with its price-to-sales (or "P/S") ratio of 2.3x, since almost half of all companies in the IT industry in China have P/S ratios greater than 3.1x and even P/S higher than 7x are not unusual. Although, it's not wise to just take the P/S at face value as there may be an explanation why it's limited.
View our latest analysis for Beijing Interact TechnologyLtd
What Does Beijing Interact TechnologyLtd's Recent Performance Look Like?
The revenue growth achieved at Beijing Interact TechnologyLtd over the last year would be more than acceptable for most companies. It might be that many expect the respectable revenue performance to degrade substantially, which has repressed the P/S. Those who are bullish on Beijing Interact TechnologyLtd will be hoping that this isn't the case, so that they can pick up the stock at a lower valuation.
We don't have analyst forecasts, but you can see how recent trends are setting up the company for the future by checking out our free report on Beijing Interact TechnologyLtd's earnings, revenue and cash flow.What Are Revenue Growth Metrics Telling Us About The Low P/S?
In order to justify its P/S ratio, Beijing Interact TechnologyLtd would need to produce sluggish growth that's trailing the industry.
If we review the last year of revenue growth, the company posted a worthy increase of 12%. The latest three year period has also seen an excellent 41% overall rise in revenue, aided somewhat by its short-term performance. So we can start by confirming that the company has done a great job of growing revenues over that time.
This is in contrast to the rest of the industry, which is expected to grow by 36% over the next year, materially higher than the company's recent medium-term annualised growth rates.
With this information, we can see why Beijing Interact TechnologyLtd is trading at a P/S lower than the industry. Apparently many shareholders weren't comfortable holding on to something they believe will continue to trail the wider industry.
The Bottom Line On Beijing Interact TechnologyLtd's P/S
Beijing Interact TechnologyLtd's P/S has taken a dip along with its share price. It's argued the price-to-sales ratio is an inferior measure of value within certain industries, but it can be a powerful business sentiment indicator.
Our examination of Beijing Interact TechnologyLtd confirms that the company's revenue trends over the past three-year years are a key factor in its low price-to-sales ratio, as we suspected, given they fall short of current industry expectations. At this stage investors feel the potential for an improvement in revenue isn't great enough to justify a higher P/S ratio. Unless the recent medium-term conditions improve, they will continue to form a barrier for the share price around these levels.
Plus, you should also learn about these 2 warning signs we've spotted with Beijing Interact TechnologyLtd (including 1 which shouldn't be ignored).
Of course, profitable companies with a history of great earnings growth are generally safer bets. So you may wish to see this free collection of other companies that have reasonable P/E ratios and have grown earnings strongly.
Valuation is complex, but we're here to simplify it.
Discover if Beijing Interact TechnologyLtd might be undervalued or overvalued with our detailed analysis, featuring fair value estimates, potential risks, dividends, insider trades, and its financial condition.
Access Free AnalysisHave feedback on this article? Concerned about the content? Get in touch with us directly. Alternatively, email editorial-team (at) simplywallst.com.
This article by Simply Wall St is general in nature. We provide commentary based on historical data and analyst forecasts only using an unbiased methodology and our articles are not intended to be financial advice. It does not constitute a recommendation to buy or sell any stock, and does not take account of your objectives, or your financial situation. We aim to bring you long-term focused analysis driven by fundamental data. Note that our analysis may not factor in the latest price-sensitive company announcements or qualitative material. Simply Wall St has no position in any stocks mentioned.
About SZSE:300419
Beijing Interact TechnologyLtd
Provides IT system solutions and digital banking solutions based on cloud computing architecture and big data business intelligence in China.
Mediocre balance sheet with very low risk.
Market Insights

Advertisement
Community Narratives
The Next Phase of Energy Storage: How NeoVolta Is Tackling America’s Power Crunch
Fair Value US$7.50|35.1% undervalued
MA
Community Contributor
Why EnSilica is Worth Possibly 13x its Current Price
Fair Value UK£5.00|89.8% undervalued
DO
Community Contributor
M&A Activity, Industry Diversification & A Defense Contract Monopoly Will Push BWXT For Healthy Long-Term Growth
Fair Value US$220.00|15.2% undervalued
CL
Community Contributor
A case for Cassiar Gold Corp (TSXV: GLDC) to reach CAD$8-10 before 2030 (X30-37)
Fair Value CA$10.00|96.0% undervalued
AG
Community Contributor