
Advertisement
A Look At The Fair Value Of Venustech Group Inc. (SZSE:002439)

Key Insights
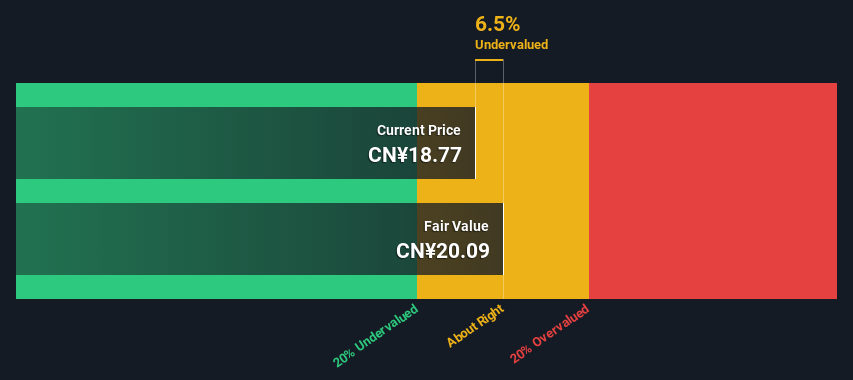
- The projected fair value for Venustech Group is CN¥20.09 based on 2 Stage Free Cash Flow to Equity
- Venustech Group's CN¥18.77 share price indicates it is trading at similar levels as its fair value estimate
- Analyst price target for 002439 is CN¥17.69 which is 12% below our fair value estimate
How far off is Venustech Group Inc. (SZSE:002439) from its intrinsic value? Using the most recent financial data, we'll take a look at whether the stock is fairly priced by estimating the company's future cash flows and discounting them to their present value. The Discounted Cash Flow (DCF) model is the tool we will apply to do this. Don't get put off by the jargon, the math behind it is actually quite straightforward.
Companies can be valued in a lot of ways, so we would point out that a DCF is not perfect for every situation. If you still have some burning questions about this type of valuation, take a look at the Simply Wall St analysis model.
Check out our latest analysis for Venustech Group
The Model
We use what is known as a 2-stage model, which simply means we have two different periods of growth rates for the company's cash flows. Generally the first stage is higher growth, and the second stage is a lower growth phase. In the first stage we need to estimate the cash flows to the business over the next ten years. Where possible we use analyst estimates, but when these aren't available we extrapolate the previous free cash flow (FCF) from the last estimate or reported value. We assume companies with shrinking free cash flow will slow their rate of shrinkage, and that companies with growing free cash flow will see their growth rate slow, over this period. We do this to reflect that growth tends to slow more in the early years than it does in later years.
A DCF is all about the idea that a dollar in the future is less valuable than a dollar today, and so the sum of these future cash flows is then discounted to today's value:
10-year free cash flow (FCF) estimate
| 2025 | 2026 | 2027 | 2028 | 2029 | 2030 | 2031 | 2032 | 2033 | 2034 | |
| Levered FCF (CN¥, Millions) | CN¥415.3m | CN¥539.7m | CN¥550.5m | CN¥798.5m | CN¥1.17b | CN¥1.40b | CN¥1.61b | CN¥1.80b | CN¥1.95b | CN¥2.09b |
| Growth Rate Estimate Source | Analyst x3 | Analyst x3 | Analyst x2 | Analyst x2 | Analyst x2 | Est @ 20.31% | Est @ 15.04% | Est @ 11.35% | Est @ 8.77% | Est @ 6.96% |
| Present Value (CN¥, Millions) Discounted @ 8.4% | CN¥383 | CN¥460 | CN¥433 | CN¥579 | CN¥780 | CN¥866 | CN¥919 | CN¥945 | CN¥948 | CN¥936 |
("Est" = FCF growth rate estimated by Simply Wall St)
Present Value of 10-year Cash Flow (PVCF) = CN¥7.2b
After calculating the present value of future cash flows in the initial 10-year period, we need to calculate the Terminal Value, which accounts for all future cash flows beyond the first stage. The Gordon Growth formula is used to calculate Terminal Value at a future annual growth rate equal to the 5-year average of the 10-year government bond yield of 2.7%. We discount the terminal cash flows to today's value at a cost of equity of 8.4%.
Terminal Value (TV)= FCF2034 × (1 + g) ÷ (r – g) = CN¥2.1b× (1 + 2.7%) ÷ (8.4%– 2.7%) = CN¥38b
Present Value of Terminal Value (PVTV)= TV / (1 + r)10= CN¥38b÷ ( 1 + 8.4%)10= CN¥17b
The total value is the sum of cash flows for the next ten years plus the discounted terminal value, which results in the Total Equity Value, which in this case is CN¥24b. To get the intrinsic value per share, we divide this by the total number of shares outstanding. Relative to the current share price of CN¥18.8, the company appears about fair value at a 6.5% discount to where the stock price trades currently. Valuations are imprecise instruments though, rather like a telescope - move a few degrees and end up in a different galaxy. Do keep this in mind.
The Assumptions
We would point out that the most important inputs to a discounted cash flow are the discount rate and of course the actual cash flows. You don't have to agree with these inputs, I recommend redoing the calculations yourself and playing with them. The DCF also does not consider the possible cyclicality of an industry, or a company's future capital requirements, so it does not give a full picture of a company's potential performance. Given that we are looking at Venustech Group as potential shareholders, the cost of equity is used as the discount rate, rather than the cost of capital (or weighted average cost of capital, WACC) which accounts for debt. In this calculation we've used 8.4%, which is based on a levered beta of 1.069. Beta is a measure of a stock's volatility, compared to the market as a whole. We get our beta from the industry average beta of globally comparable companies, with an imposed limit between 0.8 and 2.0, which is a reasonable range for a stable business.
SWOT Analysis for Venustech Group
Strength
- Currently debt free.
Weakness
- Earnings declined over the past year.
- Dividend is low compared to the top 25% of dividend payers in the Software market.
Opportunity
- Annual earnings are forecast to grow faster than the Chinese market.
- Current share price is below our estimate of fair value.
Threat
- Dividends are not covered by earnings.
- Annual revenue is forecast to grow slower than the Chinese market.
Looking Ahead:
Valuation is only one side of the coin in terms of building your investment thesis, and it shouldn't be the only metric you look at when researching a company. The DCF model is not a perfect stock valuation tool. Preferably you'd apply different cases and assumptions and see how they would impact the company's valuation. If a company grows at a different rate, or if its cost of equity or risk free rate changes sharply, the output can look very different. For Venustech Group, there are three important aspects you should further research:
- Risks: Be aware that Venustech Group is showing 2 warning signs in our investment analysis , and 1 of those can't be ignored...
- Future Earnings: How does 002439's growth rate compare to its peers and the wider market? Dig deeper into the analyst consensus number for the upcoming years by interacting with our free analyst growth expectation chart.
- Other Solid Businesses: Low debt, high returns on equity and good past performance are fundamental to a strong business. Why not explore our interactive list of stocks with solid business fundamentals to see if there are other companies you may not have considered!
PS. Simply Wall St updates its DCF calculation for every Chinese stock every day, so if you want to find the intrinsic value of any other stock just search here.
New: Manage All Your Stock Portfolios in One Place
We've created the ultimate portfolio companion for stock investors, and it's free.
• Connect an unlimited number of Portfolios and see your total in one currency
• Be alerted to new Warning Signs or Risks via email or mobile
• Track the Fair Value of your stocks
Have feedback on this article? Concerned about the content? Get in touch with us directly. Alternatively, email editorial-team (at) simplywallst.com.
This article by Simply Wall St is general in nature. We provide commentary based on historical data and analyst forecasts only using an unbiased methodology and our articles are not intended to be financial advice. It does not constitute a recommendation to buy or sell any stock, and does not take account of your objectives, or your financial situation. We aim to bring you long-term focused analysis driven by fundamental data. Note that our analysis may not factor in the latest price-sensitive company announcements or qualitative material. Simply Wall St has no position in any stocks mentioned.
About SZSE:002439
Venustech Group
Provides network security products, trusted security management platforms, and specialized security services and solutions worldwide.
Flawless balance sheet and good value.
Market Insights


Advertisement
Community Narratives
A Quality Compounder Marked Down on Overblown Fears
Fair Value US$120.72|62.4% undervalued
BA
Community Contributor

Wyndham Continues Global Expansion with 19% Ancillary Revenue Growth
Fair Value US$105.80|19.2% undervalued
ZW
Community Contributor