
Advertisement
Benign Growth For Zhejiang Heda Technology Co., Ltd. (SHSE:688296) Underpins Stock's 27% Plummet
To the annoyance of some shareholders, Zhejiang Heda Technology Co., Ltd. (SHSE:688296) shares are down a considerable 27% in the last month, which continues a horrid run for the company. The recent drop completes a disastrous twelve months for shareholders, who are sitting on a 51% loss during that time.
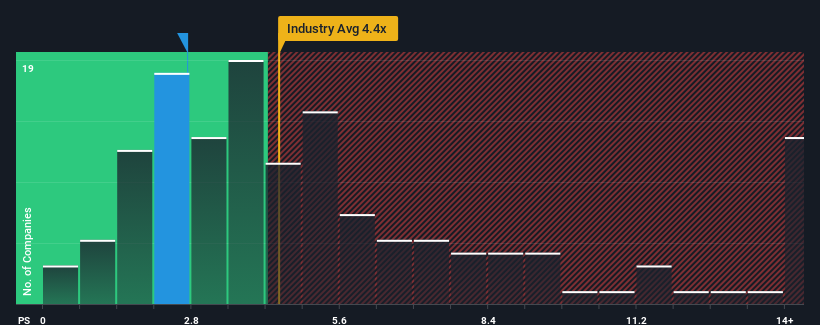
After such a large drop in price, Zhejiang Heda Technology may be sending buy signals at present with its price-to-sales (or "P/S") ratio of 2.7x, considering almost half of all companies in the Software industry in China have P/S ratios greater than 4.4x and even P/S higher than 8x aren't out of the ordinary. Although, it's not wise to just take the P/S at face value as there may be an explanation why it's limited.
View our latest analysis for Zhejiang Heda Technology
What Does Zhejiang Heda Technology's Recent Performance Look Like?
For instance, Zhejiang Heda Technology's receding revenue in recent times would have to be some food for thought. One possibility is that the P/S is low because investors think the company won't do enough to avoid underperforming the broader industry in the near future. However, if this doesn't eventuate then existing shareholders may be feeling optimistic about the future direction of the share price.
Want the full picture on earnings, revenue and cash flow for the company? Then our free report on Zhejiang Heda Technology will help you shine a light on its historical performance.How Is Zhejiang Heda Technology's Revenue Growth Trending?
The only time you'd be truly comfortable seeing a P/S as low as Zhejiang Heda Technology's is when the company's growth is on track to lag the industry.
In reviewing the last year of financials, we were disheartened to see the company's revenues fell to the tune of 27%. The last three years don't look nice either as the company has shrunk revenue by 5.6% in aggregate. Accordingly, shareholders would have felt downbeat about the medium-term rates of revenue growth.
Comparing that to the industry, which is predicted to deliver 30% growth in the next 12 months, the company's downward momentum based on recent medium-term revenue results is a sobering picture.
With this information, we are not surprised that Zhejiang Heda Technology is trading at a P/S lower than the industry. However, we think shrinking revenues are unlikely to lead to a stable P/S over the longer term, which could set up shareholders for future disappointment. Even just maintaining these prices could be difficult to achieve as recent revenue trends are already weighing down the shares.
The Key Takeaway
The southerly movements of Zhejiang Heda Technology's shares means its P/S is now sitting at a pretty low level. Generally, our preference is to limit the use of the price-to-sales ratio to establishing what the market thinks about the overall health of a company.
Our examination of Zhejiang Heda Technology confirms that the company's shrinking revenue over the past medium-term is a key factor in its low price-to-sales ratio, given the industry is projected to grow. At this stage investors feel the potential for an improvement in revenue isn't great enough to justify a higher P/S ratio. If recent medium-term revenue trends continue, it's hard to see the share price moving strongly in either direction in the near future under these circumstances.
Plus, you should also learn about these 2 warning signs we've spotted with Zhejiang Heda Technology.
If strong companies turning a profit tickle your fancy, then you'll want to check out this free list of interesting companies that trade on a low P/E (but have proven they can grow earnings).
Valuation is complex, but we're here to simplify it.
Discover if Zhejiang Heda Technology might be undervalued or overvalued with our detailed analysis, featuring fair value estimates, potential risks, dividends, insider trades, and its financial condition.
Access Free AnalysisHave feedback on this article? Concerned about the content? Get in touch with us directly. Alternatively, email editorial-team (at) simplywallst.com.
This article by Simply Wall St is general in nature. We provide commentary based on historical data and analyst forecasts only using an unbiased methodology and our articles are not intended to be financial advice. It does not constitute a recommendation to buy or sell any stock, and does not take account of your objectives, or your financial situation. We aim to bring you long-term focused analysis driven by fundamental data. Note that our analysis may not factor in the latest price-sensitive company announcements or qualitative material. Simply Wall St has no position in any stocks mentioned.
About SHSE:688296
Mediocre balance sheet and slightly overvalued.
Market Insights

Advertisement
Community Narratives
MicroVision will explode future revenue by 380.37% with a vision towards success
Fair Value US$60|98.4% undervalued
TH
Community Contributor
The Indispensable Artery for a New North American Economy
Fair Value CA$132.87|0.7% overvalued
TI
Community Contributor
Recently Updated Narratives
CO

composite32 on Astor Enerji ·
Astor Enerji will surge with a fair value of $140.43 in the next 3 years
Fair Value:₺140.4335.5% undervalued
1 followerusers have followed this narrative
0 commentsusers have commented on this narrative
0 likesusers have liked this narrative
RE

RecMag on Proximus ·
Proximus: The State-Backed Backup Plan with 7% Gross Yield and 15% Currency Upside.
Fair Value:€17.1356.7% undervalued
29 followersusers have followed this narrative
0 commentsusers have commented on this narrative
0 likesusers have liked this narrative
AG


Agricola on IMPACT Silver ·
A case for for IMPACT Silver Corp (TSXV:IPT) to reach USD $4.52 (CAD $6.16) in 2026 (23 bagger in 1 year) and USD $5.76 (CAD $7.89) by 2030
Fair Value:CA$7.8996.2% undervalued
1 followerusers have followed this narrative
0 commentsusers have commented on this narrative
0 likesusers have liked this narrative
Popular Narratives
TH

TheWallstreetKing on MicroVision ·
MicroVision will explode future revenue by 380.37% with a vision towards success
Fair Value:US$6098.4% undervalued
101 followersusers have followed this narrative
10 commentsusers have commented on this narrative
20 likesusers have liked this narrative
OS


oscargarcia on Alphabet ·
The company that turned a verb into a global necessity and basically runs the modern internet, digital ads, smartphones, maps, and AI.
Fair Value:US$3405.8% undervalued
137 followersusers have followed this narrative
6 commentsusers have commented on this narrative
18 likesusers have liked this narrative
AN


AnalystConsensusTarget on NVIDIA ·
NVDA: Expanding AI Demand Will Drive Major Data Center Investments Through 2026
Fair Value:US$250.3929.3% undervalued
929 followersusers have followed this narrative
6 commentsusers have commented on this narrative
22 likesusers have liked this narrative