Fujian Foxit Software Development Joint Stock Co., Ltd.'s (SHSE:688095) Popularity With Investors Under Threat As Stock Sinks 39%

Fujian Foxit Software Development Joint Stock Co., Ltd. (SHSE:688095) shareholders won't be pleased to see that the share price has had a very rough month, dropping 39% and undoing the prior period's positive performance. Instead of being rewarded, shareholders who have already held through the last twelve months are now sitting on a 38% share price drop.
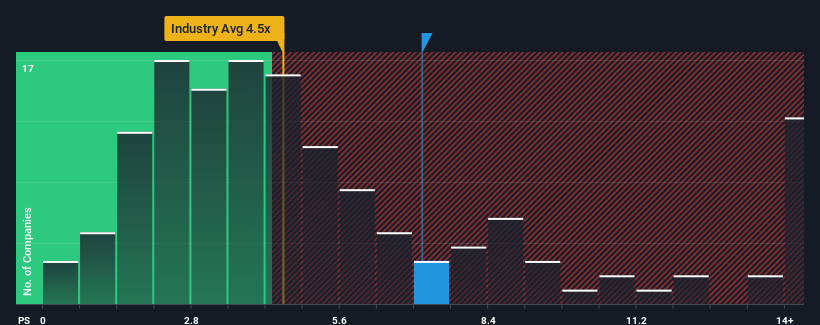
Although its price has dipped substantially, Fujian Foxit Software Development may still be sending very bearish signals at the moment with a price-to-sales (or "P/S") ratio of 7.1x, since almost half of all companies in the Software industry in China have P/S ratios under 4.5x and even P/S lower than 2x are not unusual. However, the P/S might be quite high for a reason and it requires further investigation to determine if it's justified.
Check out our latest analysis for Fujian Foxit Software Development
What Does Fujian Foxit Software Development's Recent Performance Look Like?
Fujian Foxit Software Development's revenue growth of late has been pretty similar to most other companies. It might be that many expect the mediocre revenue performance to strengthen positively, which has kept the P/S ratio from falling. If not, then existing shareholders may be a little nervous about the viability of the share price.
Want the full picture on analyst estimates for the company? Then our free report on Fujian Foxit Software Development will help you uncover what's on the horizon.Do Revenue Forecasts Match The High P/S Ratio?
Fujian Foxit Software Development's P/S ratio would be typical for a company that's expected to deliver very strong growth, and importantly, perform much better than the industry.
Retrospectively, the last year delivered a decent 5.6% gain to the company's revenues. Pleasingly, revenue has also lifted 31% in aggregate from three years ago, partly thanks to the last 12 months of growth. Accordingly, shareholders would have definitely welcomed those medium-term rates of revenue growth.
Looking ahead now, revenue is anticipated to climb by 18% during the coming year according to the four analysts following the company. With the industry predicted to deliver 30% growth, the company is positioned for a weaker revenue result.
In light of this, it's alarming that Fujian Foxit Software Development's P/S sits above the majority of other companies. Apparently many investors in the company are way more bullish than analysts indicate and aren't willing to let go of their stock at any price. There's a good chance these shareholders are setting themselves up for future disappointment if the P/S falls to levels more in line with the growth outlook.
The Key Takeaway
Even after such a strong price drop, Fujian Foxit Software Development's P/S still exceeds the industry median significantly. While the price-to-sales ratio shouldn't be the defining factor in whether you buy a stock or not, it's quite a capable barometer of revenue expectations.
It comes as a surprise to see Fujian Foxit Software Development trade at such a high P/S given the revenue forecasts look less than stellar. Right now we aren't comfortable with the high P/S as the predicted future revenues aren't likely to support such positive sentiment for long. This places shareholders' investments at significant risk and potential investors in danger of paying an excessive premium.
Having said that, be aware Fujian Foxit Software Development is showing 2 warning signs in our investment analysis, you should know about.
If companies with solid past earnings growth is up your alley, you may wish to see this free collection of other companies with strong earnings growth and low P/E ratios.
Mobile Infrastructure for Defense and Disaster
The next wave in robotics isn't humanoid. Its fully autonomous towers delivering 5G, ISR, and radar in under 30 minutes, anywhere.
Get the investor briefing before the next round of contracts
Sponsored On Behalf of CiTechNew: AI Stock Screener & Alerts
Our new AI Stock Screener scans the market every day to uncover opportunities.
• Dividend Powerhouses (3%+ Yield)
• Undervalued Small Caps with Insider Buying
• High growth Tech and AI Companies
Or build your own from over 50 metrics.
Have feedback on this article? Concerned about the content? Get in touch with us directly. Alternatively, email editorial-team (at) simplywallst.com.
This article by Simply Wall St is general in nature. We provide commentary based on historical data and analyst forecasts only using an unbiased methodology and our articles are not intended to be financial advice. It does not constitute a recommendation to buy or sell any stock, and does not take account of your objectives, or your financial situation. We aim to bring you long-term focused analysis driven by fundamental data. Note that our analysis may not factor in the latest price-sensitive company announcements or qualitative material. Simply Wall St has no position in any stocks mentioned.
About SHSE:688095
Fujian Foxit Software Development
Fujian Foxit Software Development Joint Stock Co., Ltd.
Reasonable growth potential with adequate balance sheet.
Market Insights

Weekly Picks

Early mover in a fast growing industry. Likely to experience share price volatility as they scale


A case for CA$31.80 (undiluted), aka 8,616% upside from CA$0.37 (an 86 bagger!).


Moderation and Stabilisation: HOLD: Fair Price based on a 4-year Cycle is $12.08
Recently Updated Narratives


Title: Market Sentiment Is Dead Wrong — Here's Why PSEC Deserves a Second Look


An amazing opportunity to potentially get a 100 bagger

Amazon: Why the World’s Biggest Platform Still Runs on Invisible Economics
Popular Narratives


Crazy Undervalued 42 Baggers Silver Play (Active & Running Mine)


MicroVision will explode future revenue by 380.37% with a vision towards success


NVDA: Expanding AI Demand Will Drive Major Data Center Investments Through 2026
Trending Discussion
