The Price Is Right For Shanghai Wondertek Software Co., Ltd (SHSE:603189) Even After Diving 30%

Shanghai Wondertek Software Co., Ltd (SHSE:603189) shareholders that were waiting for something to happen have been dealt a blow with a 30% share price drop in the last month. Instead of being rewarded, shareholders who have already held through the last twelve months are now sitting on a 31% share price drop.
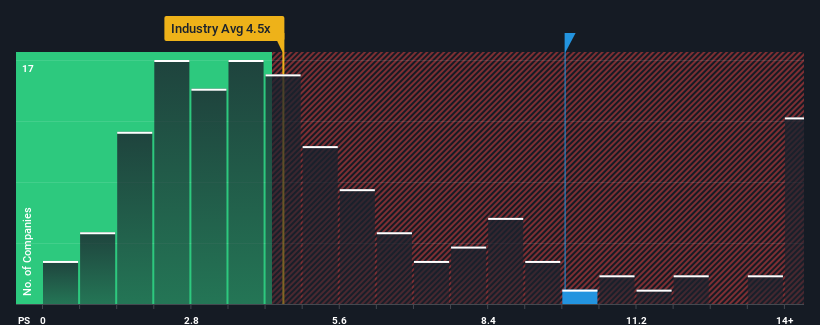
Although its price has dipped substantially, Shanghai Wondertek Software's price-to-sales (or "P/S") ratio of 9.8x might still make it look like a strong sell right now compared to other companies in the Software industry in China, where around half of the companies have P/S ratios below 4.5x and even P/S below 2x are quite common. Nonetheless, we'd need to dig a little deeper to determine if there is a rational basis for the highly elevated P/S.
View our latest analysis for Shanghai Wondertek Software
How Has Shanghai Wondertek Software Performed Recently?
Shanghai Wondertek Software hasn't been tracking well recently as its declining revenue compares poorly to other companies, which have seen some growth in their revenues on average. One possibility is that the P/S ratio is high because investors think this poor revenue performance will turn the corner. If not, then existing shareholders may be extremely nervous about the viability of the share price.
Want the full picture on analyst estimates for the company? Then our free report on Shanghai Wondertek Software will help you uncover what's on the horizon.Is There Enough Revenue Growth Forecasted For Shanghai Wondertek Software?
The only time you'd be truly comfortable seeing a P/S as steep as Shanghai Wondertek Software's is when the company's growth is on track to outshine the industry decidedly.
Retrospectively, the last year delivered a frustrating 6.7% decrease to the company's top line. As a result, revenue from three years ago have also fallen 9.9% overall. So unfortunately, we have to acknowledge that the company has not done a great job of growing revenue over that time.
Shifting to the future, estimates from the lone analyst covering the company suggest revenue should grow by 158% over the next year. With the industry only predicted to deliver 30%, the company is positioned for a stronger revenue result.
With this information, we can see why Shanghai Wondertek Software is trading at such a high P/S compared to the industry. It seems most investors are expecting this strong future growth and are willing to pay more for the stock.
What We Can Learn From Shanghai Wondertek Software's P/S?
A significant share price dive has done very little to deflate Shanghai Wondertek Software's very lofty P/S. While the price-to-sales ratio shouldn't be the defining factor in whether you buy a stock or not, it's quite a capable barometer of revenue expectations.
As we suspected, our examination of Shanghai Wondertek Software's analyst forecasts revealed that its superior revenue outlook is contributing to its high P/S. At this stage investors feel the potential for a deterioration in revenues is quite remote, justifying the elevated P/S ratio. Unless the analysts have really missed the mark, these strong revenue forecasts should keep the share price buoyant.
There are also other vital risk factors to consider and we've discovered 3 warning signs for Shanghai Wondertek Software (2 are a bit unpleasant!) that you should be aware of before investing here.
Of course, profitable companies with a history of great earnings growth are generally safer bets. So you may wish to see this free collection of other companies that have reasonable P/E ratios and have grown earnings strongly.
The New Payments ETF Is Live on NASDAQ:
Money is moving to real-time rails, and a newly listed ETF now gives investors direct exposure. Fast settlement. Institutional custody. Simple access.
Explore how this launch could reshape portfolios
Sponsored ContentNew: Manage All Your Stock Portfolios in One Place
We've created the ultimate portfolio companion for stock investors, and it's free.
• Connect an unlimited number of Portfolios and see your total in one currency
• Be alerted to new Warning Signs or Risks via email or mobile
• Track the Fair Value of your stocks
Have feedback on this article? Concerned about the content? Get in touch with us directly. Alternatively, email editorial-team (at) simplywallst.com.
This article by Simply Wall St is general in nature. We provide commentary based on historical data and analyst forecasts only using an unbiased methodology and our articles are not intended to be financial advice. It does not constitute a recommendation to buy or sell any stock, and does not take account of your objectives, or your financial situation. We aim to bring you long-term focused analysis driven by fundamental data. Note that our analysis may not factor in the latest price-sensitive company announcements or qualitative material. Simply Wall St has no position in any stocks mentioned.
About SHSE:603189
Shanghai Wondertek Software
Provides software products and solutions for video intelligence field in China.
Flawless balance sheet with slight risk.
Market Insights

Weekly Picks

THE KINGDOM OF BROWN GOODS: WHY MGPI IS BEING CRUSHED BY INVENTORY & PRIMED FOR RESURRECTION


Why Vertical Aerospace (NYSE: EVTL) is Worth Possibly Over 13x its Current Price


The Quiet Giant That Became AI’s Power Grid
Recently Updated Narratives


MINISO's fair value is projected at 26.69 with an anticipated PE ratio shift of 20x

Fiverr International will transform the freelance industry with AI-powered growth

Stride Stock: Online Education Finds Its Second Act
Popular Narratives


MicroVision will explode future revenue by 380.37% with a vision towards success


Crazy Undervalued 42 Baggers Silver Play (Active & Running Mine)


