Stock Analysis
CETC Digital Technology Co.,Ltd.'s (SHSE:600850) Stock Has Been Sliding But Fundamentals Look Strong: Is The Market Wrong?


CETC Digital TechnologyLtd (SHSE:600850) has had a rough three months with its share price down 13%. However, stock prices are usually driven by a company’s financial performance over the long term, which in this case looks quite promising. Specifically, we decided to study CETC Digital TechnologyLtd's ROE in this article.
Return on equity or ROE is a key measure used to assess how efficiently a company's management is utilizing the company's capital. In other words, it is a profitability ratio which measures the rate of return on the capital provided by the company's shareholders.
See our latest analysis for CETC Digital TechnologyLtd
How Is ROE Calculated?
The formula for return on equity is:
Return on Equity = Net Profit (from continuing operations) ÷ Shareholders' Equity
So, based on the above formula, the ROE for CETC Digital TechnologyLtd is:
11% = CN¥528m ÷ CN¥4.7b (Based on the trailing twelve months to March 2024).
The 'return' is the amount earned after tax over the last twelve months. Another way to think of that is that for every CN¥1 worth of equity, the company was able to earn CN¥0.11 in profit.
What Is The Relationship Between ROE And Earnings Growth?
So far, we've learned that ROE is a measure of a company's profitability. Depending on how much of these profits the company reinvests or "retains", and how effectively it does so, we are then able to assess a company’s earnings growth potential. Generally speaking, other things being equal, firms with a high return on equity and profit retention, have a higher growth rate than firms that don’t share these attributes.
CETC Digital TechnologyLtd's Earnings Growth And 11% ROE
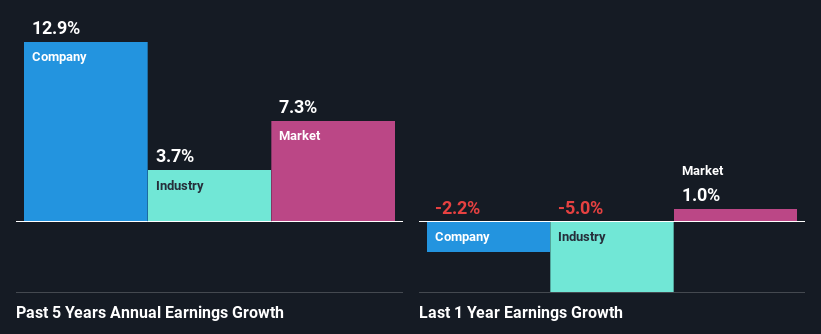
To begin with, CETC Digital TechnologyLtd seems to have a respectable ROE. Especially when compared to the industry average of 5.2% the company's ROE looks pretty impressive. Probably as a result of this, CETC Digital TechnologyLtd was able to see a decent growth of 13% over the last five years.
We then compared CETC Digital TechnologyLtd's net income growth with the industry and we're pleased to see that the company's growth figure is higher when compared with the industry which has a growth rate of 3.7% in the same 5-year period.
Earnings growth is an important metric to consider when valuing a stock. The investor should try to establish if the expected growth or decline in earnings, whichever the case may be, is priced in. This then helps them determine if the stock is placed for a bright or bleak future. If you're wondering about CETC Digital TechnologyLtd's's valuation, check out this gauge of its price-to-earnings ratio, as compared to its industry.
Is CETC Digital TechnologyLtd Efficiently Re-investing Its Profits?
CETC Digital TechnologyLtd has a three-year median payout ratio of 41%, which implies that it retains the remaining 59% of its profits. This suggests that its dividend is well covered, and given the decent growth seen by the company, it looks like management is reinvesting its earnings efficiently.
Besides, CETC Digital TechnologyLtd has been paying dividends for at least ten years or more. This shows that the company is committed to sharing profits with its shareholders.
Conclusion
On the whole, we feel that CETC Digital TechnologyLtd's performance has been quite good. In particular, it's great to see that the company is investing heavily into its business and along with a high rate of return, that has resulted in a sizeable growth in its earnings. That being so, the latest analyst forecasts show that the company will continue to see an expansion in its earnings. Are these analysts expectations based on the broad expectations for the industry, or on the company's fundamentals? Click here to be taken to our analyst's forecasts page for the company.
New: AI Stock Screener & Alerts
Our new AI Stock Screener scans the market every day to uncover opportunities.
• Dividend Powerhouses (3%+ Yield)
• Undervalued Small Caps with Insider Buying
• High growth Tech and AI Companies
Or build your own from over 50 metrics.
Have feedback on this article? Concerned about the content? Get in touch with us directly. Alternatively, email editorial-team (at) simplywallst.com.
This article by Simply Wall St is general in nature. We provide commentary based on historical data and analyst forecasts only using an unbiased methodology and our articles are not intended to be financial advice. It does not constitute a recommendation to buy or sell any stock, and does not take account of your objectives, or your financial situation. We aim to bring you long-term focused analysis driven by fundamental data. Note that our analysis may not factor in the latest price-sensitive company announcements or qualitative material. Simply Wall St has no position in any stocks mentioned.
Have feedback on this article? Concerned about the content? Get in touch with us directly. Alternatively, email editorial-team@simplywallst.com
About SHSE:600850
CETC Digital TechnologyLtd
Provides software and information technology services in China.
Adequate balance sheet average dividend payer.
