
Advertisement
- China
- /
- Semiconductors
- /
- SZSE:300458
Estimating The Fair Value Of Allwinnertech Technology Co.,Ltd. (SZSE:300458)
Key Insights
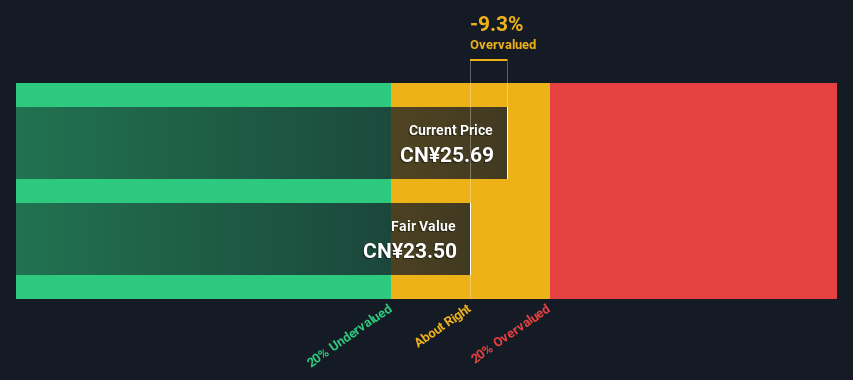
- Allwinnertech TechnologyLtd's estimated fair value is CN¥23.50 based on 2 Stage Free Cash Flow to Equity
- With CN¥25.69 share price, Allwinnertech TechnologyLtd appears to be trading close to its estimated fair value
- When compared to theindustry average discount of -1,521%, Allwinnertech TechnologyLtd's competitors seem to be trading at a greater premium to fair value
In this article we are going to estimate the intrinsic value of Allwinnertech Technology Co.,Ltd. (SZSE:300458) by taking the expected future cash flows and discounting them to their present value. The Discounted Cash Flow (DCF) model is the tool we will apply to do this. There's really not all that much to it, even though it might appear quite complex.
We would caution that there are many ways of valuing a company and, like the DCF, each technique has advantages and disadvantages in certain scenarios. If you want to learn more about discounted cash flow, the rationale behind this calculation can be read in detail in the Simply Wall St analysis model.
See our latest analysis for Allwinnertech TechnologyLtd
The Calculation
We are going to use a two-stage DCF model, which, as the name states, takes into account two stages of growth. The first stage is generally a higher growth period which levels off heading towards the terminal value, captured in the second 'steady growth' period. In the first stage we need to estimate the cash flows to the business over the next ten years. Seeing as no analyst estimates of free cash flow are available to us, we have extrapolate the previous free cash flow (FCF) from the company's last reported value. We assume companies with shrinking free cash flow will slow their rate of shrinkage, and that companies with growing free cash flow will see their growth rate slow, over this period. We do this to reflect that growth tends to slow more in the early years than it does in later years.
Generally we assume that a dollar today is more valuable than a dollar in the future, and so the sum of these future cash flows is then discounted to today's value:
10-year free cash flow (FCF) forecast
| 2025 | 2026 | 2027 | 2028 | 2029 | 2030 | 2031 | 2032 | 2033 | 2034 | |
| Levered FCF (CN¥, Millions) | CN¥387.0m | CN¥508.3m | CN¥624.2m | CN¥729.1m | CN¥821.1m | CN¥900.7m | CN¥969.5m | CN¥1.03b | CN¥1.08b | CN¥1.13b |
| Growth Rate Estimate Source | Est @ 43.55% | Est @ 31.34% | Est @ 22.79% | Est @ 16.81% | Est @ 12.62% | Est @ 9.69% | Est @ 7.64% | Est @ 6.20% | Est @ 5.20% | Est @ 4.49% |
| Present Value (CN¥, Millions) Discounted @ 9.4% | CN¥354 | CN¥424 | CN¥476 | CN¥508 | CN¥523 | CN¥524 | CN¥516 | CN¥500 | CN¥481 | CN¥459 |
("Est" = FCF growth rate estimated by Simply Wall St)
Present Value of 10-year Cash Flow (PVCF) = CN¥4.8b
We now need to calculate the Terminal Value, which accounts for all the future cash flows after this ten year period. The Gordon Growth formula is used to calculate Terminal Value at a future annual growth rate equal to the 5-year average of the 10-year government bond yield of 2.9%. We discount the terminal cash flows to today's value at a cost of equity of 9.4%.
Terminal Value (TV)= FCF2034 × (1 + g) ÷ (r – g) = CN¥1.1b× (1 + 2.9%) ÷ (9.4%– 2.9%) = CN¥18b
Present Value of Terminal Value (PVTV)= TV / (1 + r)10= CN¥18b÷ ( 1 + 9.4%)10= CN¥7.2b
The total value, or equity value, is then the sum of the present value of the future cash flows, which in this case is CN¥12b. In the final step we divide the equity value by the number of shares outstanding. Compared to the current share price of CN¥25.7, the company appears around fair value at the time of writing. Remember though, that this is just an approximate valuation, and like any complex formula - garbage in, garbage out.
The Assumptions
Now the most important inputs to a discounted cash flow are the discount rate, and of course, the actual cash flows. Part of investing is coming up with your own evaluation of a company's future performance, so try the calculation yourself and check your own assumptions. The DCF also does not consider the possible cyclicality of an industry, or a company's future capital requirements, so it does not give a full picture of a company's potential performance. Given that we are looking at Allwinnertech TechnologyLtd as potential shareholders, the cost of equity is used as the discount rate, rather than the cost of capital (or weighted average cost of capital, WACC) which accounts for debt. In this calculation we've used 9.4%, which is based on a levered beta of 1.323. Beta is a measure of a stock's volatility, compared to the market as a whole. We get our beta from the industry average beta of globally comparable companies, with an imposed limit between 0.8 and 2.0, which is a reasonable range for a stable business.
SWOT Analysis for Allwinnertech TechnologyLtd
Strength
- Earnings growth over the past year exceeded the industry.
- Debt is not viewed as a risk.
- Dividends are covered by earnings and cash flows.
Weakness
- Dividend is low compared to the top 25% of dividend payers in the Semiconductor market.
- Expensive based on P/E ratio and estimated fair value.
Opportunity
- Annual earnings are forecast to grow faster than the Chinese market.
Threat
- No apparent threats visible for 300458.
Looking Ahead:
Although the valuation of a company is important, it shouldn't be the only metric you look at when researching a company. The DCF model is not a perfect stock valuation tool. Rather it should be seen as a guide to "what assumptions need to be true for this stock to be under/overvalued?" For instance, if the terminal value growth rate is adjusted slightly, it can dramatically alter the overall result. For Allwinnertech TechnologyLtd, we've put together three additional factors you should further examine:
- Risks: As an example, we've found 2 warning signs for Allwinnertech TechnologyLtd that you need to consider before investing here.
- Future Earnings: How does 300458's growth rate compare to its peers and the wider market? Dig deeper into the analyst consensus number for the upcoming years by interacting with our free analyst growth expectation chart.
- Other High Quality Alternatives: Do you like a good all-rounder? Explore our interactive list of high quality stocks to get an idea of what else is out there you may be missing!
PS. The Simply Wall St app conducts a discounted cash flow valuation for every stock on the SZSE every day. If you want to find the calculation for other stocks just search here.
New: Manage All Your Stock Portfolios in One Place
We've created the ultimate portfolio companion for stock investors, and it's free.
• Connect an unlimited number of Portfolios and see your total in one currency
• Be alerted to new Warning Signs or Risks via email or mobile
• Track the Fair Value of your stocks
Have feedback on this article? Concerned about the content? Get in touch with us directly. Alternatively, email editorial-team (at) simplywallst.com.
This article by Simply Wall St is general in nature. We provide commentary based on historical data and analyst forecasts only using an unbiased methodology and our articles are not intended to be financial advice. It does not constitute a recommendation to buy or sell any stock, and does not take account of your objectives, or your financial situation. We aim to bring you long-term focused analysis driven by fundamental data. Note that our analysis may not factor in the latest price-sensitive company announcements or qualitative material. Simply Wall St has no position in any stocks mentioned.
Have feedback on this article? Concerned about the content? Get in touch with us directly. Alternatively, email editorial-team@simplywallst.com
About SZSE:300458
Allwinner TechnologyLtd
Researches, develops, designs, manufactures, and sells intelligent application SoC, analog components, and wireless interconnect chips in China.
High growth potential with excellent balance sheet and pays a dividend.
Similar Companies
Market Insights

Advertisement
Community Narratives
MINISO's fair value is projected at 26.69 with an anticipated PE ratio shift of 20x
Fair Value US$24.03|11.0% undervalued
BE
Community Contributor
Procter & Gamble: A Dividend Giant Facing Slowing Growth
Fair Value US$119.81|23.3% overvalued
AN
Community Contributor
Eli Lilly's Future Growth Driven by Tirzepatide and Favorable Market Conditions
Fair Value US$1.19k|13.8% undervalued
EA
Community Contributor