
Advertisement
- China
- /
- Semiconductors
- /
- SZSE:300046
More Unpleasant Surprises Could Be In Store For Tech Semiconductors Co., Ltd.'s (SZSE:300046) Shares After Tumbling 26%
Tech Semiconductors Co., Ltd. (SZSE:300046) shareholders that were waiting for something to happen have been dealt a blow with a 26% share price drop in the last month. The drop over the last 30 days has capped off a tough year for shareholders, with the share price down 40% in that time.
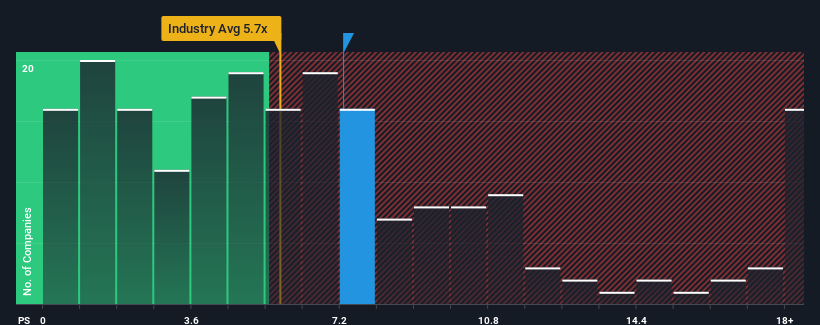
Even after such a large drop in price, Tech Semiconductors' price-to-sales (or "P/S") ratio of 7.3x might still make it look like a sell right now compared to the wider Semiconductor industry in China, where around half of the companies have P/S ratios below 5.7x and even P/S below 2x are quite common. However, the P/S might be high for a reason and it requires further investigation to determine if it's justified.
Check out our latest analysis for Tech Semiconductors
What Does Tech Semiconductors' Recent Performance Look Like?
As an illustration, revenue has deteriorated at Tech Semiconductors over the last year, which is not ideal at all. One possibility is that the P/S is high because investors think the company will still do enough to outperform the broader industry in the near future. You'd really hope so, otherwise you're paying a pretty hefty price for no particular reason.
We don't have analyst forecasts, but you can see how recent trends are setting up the company for the future by checking out our free report on Tech Semiconductors' earnings, revenue and cash flow.Do Revenue Forecasts Match The High P/S Ratio?
The only time you'd be truly comfortable seeing a P/S as high as Tech Semiconductors' is when the company's growth is on track to outshine the industry.
Taking a look back first, the company's revenue growth last year wasn't something to get excited about as it posted a disappointing decline of 11%. As a result, revenue from three years ago have also fallen 25% overall. Therefore, it's fair to say the revenue growth recently has been undesirable for the company.
In contrast to the company, the rest of the industry is expected to grow by 34% over the next year, which really puts the company's recent medium-term revenue decline into perspective.
With this information, we find it concerning that Tech Semiconductors is trading at a P/S higher than the industry. Apparently many investors in the company are way more bullish than recent times would indicate and aren't willing to let go of their stock at any price. There's a very good chance existing shareholders are setting themselves up for future disappointment if the P/S falls to levels more in line with the recent negative growth rates.
The Bottom Line On Tech Semiconductors' P/S
There's still some elevation in Tech Semiconductors' P/S, even if the same can't be said for its share price recently. Using the price-to-sales ratio alone to determine if you should sell your stock isn't sensible, however it can be a practical guide to the company's future prospects.
We've established that Tech Semiconductors currently trades on a much higher than expected P/S since its recent revenues have been in decline over the medium-term. With a revenue decline on investors' minds, the likelihood of a souring sentiment is quite high which could send the P/S back in line with what we'd expect. Unless the recent medium-term conditions improve markedly, investors will have a hard time accepting the share price as fair value.
Many other vital risk factors can be found on the company's balance sheet. Our free balance sheet analysis for Tech Semiconductors with six simple checks will allow you to discover any risks that could be an issue.
If strong companies turning a profit tickle your fancy, then you'll want to check out this free list of interesting companies that trade on a low P/E (but have proven they can grow earnings).
Valuation is complex, but we're here to simplify it.
Discover if Tech Semiconductors might be undervalued or overvalued with our detailed analysis, featuring fair value estimates, potential risks, dividends, insider trades, and its financial condition.
Access Free AnalysisHave feedback on this article? Concerned about the content? Get in touch with us directly. Alternatively, email editorial-team (at) simplywallst.com.
This article by Simply Wall St is general in nature. We provide commentary based on historical data and analyst forecasts only using an unbiased methodology and our articles are not intended to be financial advice. It does not constitute a recommendation to buy or sell any stock, and does not take account of your objectives, or your financial situation. We aim to bring you long-term focused analysis driven by fundamental data. Note that our analysis may not factor in the latest price-sensitive company announcements or qualitative material. Simply Wall St has no position in any stocks mentioned.
About SZSE:300046
Tech Semiconductors
Engages in the development, manufacture, and sale of power semiconductor devices in China.
Flawless balance sheet with solid track record.
Market Insights

Advertisement
Weekly Picks
RO


RockeTeller on Santacruz Silver Mining ·
Crazy Undervalued 42 Baggers Silver Play (Active & Running Mine)
Fair Value:CA$8696.7% undervalued
46 followersusers have followed this narrative
6 commentsusers have commented on this narrative
15 likesusers have liked this narrative
RO


Robbo on Fiducian Group ·
Fiducian: Compliance Clouds or Value Opportunity?
Fair Value:AU$123.8% undervalued
7 followersusers have followed this narrative
0 commentsusers have commented on this narrative
0 likesusers have liked this narrative
WO

woodworthfund on Willamette Valley Vineyards ·
Willamette Valley Vineyards (WVVI): Not-So-Great Value
Fair Value:US$247.5% overvalued
9 followersusers have followed this narrative
0 commentsusers have commented on this narrative
1 likeusers have liked this narrative
Recently Updated Narratives
IN

IncomeAssets on Pulse Seismic ·
Watch Pulse Seismic Outperform with 13.6% Revenue Growth in the Coming Years
Fair Value:CA$4.4729.5% undervalued
1 followerusers have followed this narrative
0 commentsusers have commented on this narrative
0 likesusers have liked this narrative
VL

Vladislav on Galleon Gold ·
Significantly undervalued gold explorer in Timmins, finally getting traction
Fair Value:CA$482.8% undervalued
4 followersusers have followed this narrative
0 commentsusers have commented on this narrative
0 likesusers have liked this narrative
FU

FundamentallySarcastic on Credit Corp Group ·
Moderation and Stabilisation: HOLD: Fair Price based on a 4-year Cycle is $12.08
Fair Value:AU$12.6411.8% overvalued
4 followersusers have followed this narrative
0 commentsusers have commented on this narrative
0 likesusers have liked this narrative
Popular Narratives
TH


TheWallstreetKing on MicroVision ·
MicroVision will explode future revenue by 380.37% with a vision towards success
Fair Value:US$6098.5% undervalued
116 followersusers have followed this narrative
11 commentsusers have commented on this narrative
22 likesusers have liked this narrative
AN


AnalystConsensusTarget on NVIDIA ·
NVDA: Expanding AI Demand Will Drive Major Data Center Investments Through 2026
Fair Value:US$250.3926.8% undervalued
957 followersusers have followed this narrative
6 commentsusers have commented on this narrative
25 likesusers have liked this narrative
AN

AnalystConsensusTarget on Alphabet ·
GOOGL: AI Platform Expansion And Cloud Demand Will Support Durable Performance Amid Competitive Pressures
Fair Value:US$323.71.9% undervalued
1342 followersusers have followed this narrative
0 commentsusers have commented on this narrative
17 likesusers have liked this narrative

