
Advertisement
- China
- /
- Semiconductors
- /
- SHSE:688383
Investors Give Shenzhen Xinyichang Technology Co., Ltd. (SHSE:688383) Shares A 27% Hiding

The Shenzhen Xinyichang Technology Co., Ltd. (SHSE:688383) share price has fared very poorly over the last month, falling by a substantial 27%. The recent drop completes a disastrous twelve months for shareholders, who are sitting on a 65% loss during that time.
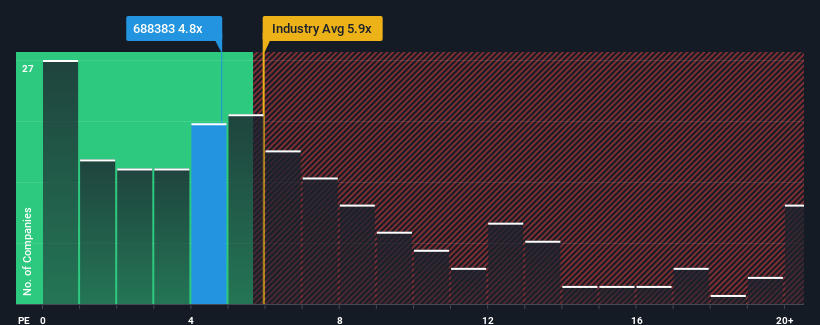
Even after such a large drop in price, you could still be forgiven for feeling indifferent about Shenzhen Xinyichang Technology's P/S ratio of 4.8x, since the median price-to-sales (or "P/S") ratio for the Semiconductor industry in China is also close to 5.9x. Although, it's not wise to simply ignore the P/S without explanation as investors may be disregarding a distinct opportunity or a costly mistake.
View our latest analysis for Shenzhen Xinyichang Technology
What Does Shenzhen Xinyichang Technology's Recent Performance Look Like?
While the industry has experienced revenue growth lately, Shenzhen Xinyichang Technology's revenue has gone into reverse gear, which is not great. Perhaps the market is expecting its poor revenue performance to improve, keeping the P/S from dropping. If not, then existing shareholders may be a little nervous about the viability of the share price.
Want the full picture on analyst estimates for the company? Then our free report on Shenzhen Xinyichang Technology will help you uncover what's on the horizon.Is There Some Revenue Growth Forecasted For Shenzhen Xinyichang Technology?
In order to justify its P/S ratio, Shenzhen Xinyichang Technology would need to produce growth that's similar to the industry.
Retrospectively, the last year delivered a frustrating 21% decrease to the company's top line. That put a dampener on the good run it was having over the longer-term as its three-year revenue growth is still a noteworthy 27% in total. Although it's been a bumpy ride, it's still fair to say the revenue growth recently has been mostly respectable for the company.
Shifting to the future, estimates from the three analysts covering the company suggest revenue should grow by 50% over the next year. Meanwhile, the rest of the industry is forecast to only expand by 36%, which is noticeably less attractive.
With this information, we find it interesting that Shenzhen Xinyichang Technology is trading at a fairly similar P/S compared to the industry. It may be that most investors aren't convinced the company can achieve future growth expectations.
The Bottom Line On Shenzhen Xinyichang Technology's P/S
Shenzhen Xinyichang Technology's plummeting stock price has brought its P/S back to a similar region as the rest of the industry. Using the price-to-sales ratio alone to determine if you should sell your stock isn't sensible, however it can be a practical guide to the company's future prospects.
Looking at Shenzhen Xinyichang Technology's analyst forecasts revealed that its superior revenue outlook isn't giving the boost to its P/S that we would've expected. There could be some risks that the market is pricing in, which is preventing the P/S ratio from matching the positive outlook. However, if you agree with the analysts' forecasts, you may be able to pick up the stock at an attractive price.
It's always necessary to consider the ever-present spectre of investment risk. We've identified 4 warning signs with Shenzhen Xinyichang Technology (at least 1 which is a bit concerning), and understanding these should be part of your investment process.
If these risks are making you reconsider your opinion on Shenzhen Xinyichang Technology, explore our interactive list of high quality stocks to get an idea of what else is out there.
New: Manage All Your Stock Portfolios in One Place
We've created the ultimate portfolio companion for stock investors, and it's free.
• Connect an unlimited number of Portfolios and see your total in one currency
• Be alerted to new Warning Signs or Risks via email or mobile
• Track the Fair Value of your stocks
Have feedback on this article? Concerned about the content? Get in touch with us directly. Alternatively, email editorial-team (at) simplywallst.com.
This article by Simply Wall St is general in nature. We provide commentary based on historical data and analyst forecasts only using an unbiased methodology and our articles are not intended to be financial advice. It does not constitute a recommendation to buy or sell any stock, and does not take account of your objectives, or your financial situation. We aim to bring you long-term focused analysis driven by fundamental data. Note that our analysis may not factor in the latest price-sensitive company announcements or qualitative material. Simply Wall St has no position in any stocks mentioned.
Have feedback on this article? Concerned about the content? Get in touch with us directly. Alternatively, email editorial-team@simplywallst.com
About SHSE:688383
Shenzhen Xinyichang Technology
Engages in the research and development, production, and sale of intelligent manufacturing equipment for LED, capacitor, semiconductor, lithium battery, and other industries in China.
Mediocre balance sheet low.
Market Insights

Advertisement
Community Narratives

BMW cruising ahead with new EVs and premium models to boost revenue 5%
Fair Value €135.07|44.6% undervalued
UN
Community Contributor
EU#2 - From Humble Beginnings to Global Powerhouse
Fair Value DKK 851.04|46.4% undervalued
TO
Community Contributor