- China
- /
- Semiconductors
- /
- SHSE:688153
Vanchip (Tianjin) Technology Co., Ltd.'s (SHSE:688153) 26% Share Price Surge Not Quite Adding Up

Those holding Vanchip (Tianjin) Technology Co., Ltd. (SHSE:688153) shares would be relieved that the share price has rebounded 26% in the last thirty days, but it needs to keep going to repair the recent damage it has caused to investor portfolios. The last 30 days bring the annual gain to a very sharp 26%.
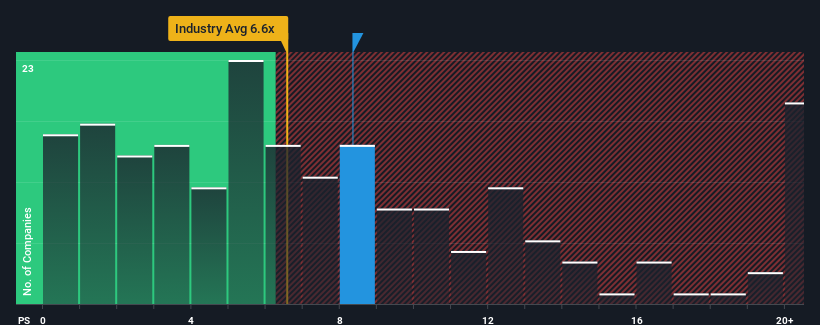
Following the firm bounce in price, Vanchip (Tianjin) Technology may be sending sell signals at present with a price-to-sales (or "P/S") ratio of 8.3x, when you consider almost half of the companies in the Semiconductor industry in China have P/S ratios under 6.6x and even P/S lower than 3x aren't out of the ordinary. Although, it's not wise to just take the P/S at face value as there may be an explanation why it's as high as it is.
View our latest analysis for Vanchip (Tianjin) Technology

What Does Vanchip (Tianjin) Technology's Recent Performance Look Like?
With revenue growth that's superior to most other companies of late, Vanchip (Tianjin) Technology has been doing relatively well. It seems the market expects this form will continue into the future, hence the elevated P/S ratio. However, if this isn't the case, investors might get caught out paying too much for the stock.
If you'd like to see what analysts are forecasting going forward, you should check out our free report on Vanchip (Tianjin) Technology.Do Revenue Forecasts Match The High P/S Ratio?
In order to justify its P/S ratio, Vanchip (Tianjin) Technology would need to produce impressive growth in excess of the industry.
If we review the last year of revenue growth, the company posted a terrific increase of 30%. Pleasingly, revenue has also lifted 65% in aggregate from three years ago, thanks to the last 12 months of growth. Accordingly, shareholders would have definitely welcomed those medium-term rates of revenue growth.
Looking ahead now, revenue is anticipated to climb by 26% during the coming year according to the six analysts following the company. Meanwhile, the rest of the industry is forecast to expand by 20,706%, which is noticeably more attractive.
With this in consideration, we believe it doesn't make sense that Vanchip (Tianjin) Technology's P/S is outpacing its industry peers. Apparently many investors in the company are way more bullish than analysts indicate and aren't willing to let go of their stock at any price. There's a good chance these shareholders are setting themselves up for future disappointment if the P/S falls to levels more in line with the growth outlook.
What We Can Learn From Vanchip (Tianjin) Technology's P/S?
Vanchip (Tianjin) Technology shares have taken a big step in a northerly direction, but its P/S is elevated as a result. While the price-to-sales ratio shouldn't be the defining factor in whether you buy a stock or not, it's quite a capable barometer of revenue expectations.
We've concluded that Vanchip (Tianjin) Technology currently trades on a much higher than expected P/S since its forecast growth is lower than the wider industry. The weakness in the company's revenue estimate doesn't bode well for the elevated P/S, which could take a fall if the revenue sentiment doesn't improve. At these price levels, investors should remain cautious, particularly if things don't improve.
There are also other vital risk factors to consider before investing and we've discovered 1 warning sign for Vanchip (Tianjin) Technology that you should be aware of.
It's important to make sure you look for a great company, not just the first idea you come across. So if growing profitability aligns with your idea of a great company, take a peek at this free list of interesting companies with strong recent earnings growth (and a low P/E).
If you're looking to trade Vanchip (Tianjin) Technology, open an account with the lowest-cost platform trusted by professionals, Interactive Brokers.
With clients in over 200 countries and territories, and access to 160 markets, IBKR lets you trade stocks, options, futures, forex, bonds and funds from a single integrated account.
Enjoy no hidden fees, no account minimums, and FX conversion rates as low as 0.03%, far better than what most brokers offer.
Sponsored ContentNew: Manage All Your Stock Portfolios in One Place
We've created the ultimate portfolio companion for stock investors, and it's free.
• Connect an unlimited number of Portfolios and see your total in one currency
• Be alerted to new Warning Signs or Risks via email or mobile
• Track the Fair Value of your stocks
Have feedback on this article? Concerned about the content? Get in touch with us directly. Alternatively, email editorial-team (at) simplywallst.com.
This article by Simply Wall St is general in nature. We provide commentary based on historical data and analyst forecasts only using an unbiased methodology and our articles are not intended to be financial advice. It does not constitute a recommendation to buy or sell any stock, and does not take account of your objectives, or your financial situation. We aim to bring you long-term focused analysis driven by fundamental data. Note that our analysis may not factor in the latest price-sensitive company announcements or qualitative material. Simply Wall St has no position in any stocks mentioned.
About SHSE:688153
Vanchip (Tianjin) Technology
Designs, manufactures, and sells radio frequency front end and high end analog chips in China.
High growth potential with adequate balance sheet.
Market Insights
Community Narratives


