
Advertisement
- China
- /
- Semiconductors
- /
- SHSE:600703
Sanan OptoelectronicsLtd (SHSE:600703) Is Carrying A Fair Bit Of Debt

David Iben put it well when he said, 'Volatility is not a risk we care about. What we care about is avoiding the permanent loss of capital.' So it might be obvious that you need to consider debt, when you think about how risky any given stock is, because too much debt can sink a company. We note that Sanan Optoelectronics Co.,Ltd (SHSE:600703) does have debt on its balance sheet. But should shareholders be worried about its use of debt?
When Is Debt Dangerous?
Debt and other liabilities become risky for a business when it cannot easily fulfill those obligations, either with free cash flow or by raising capital at an attractive price. Part and parcel of capitalism is the process of 'creative destruction' where failed businesses are mercilessly liquidated by their bankers. While that is not too common, we often do see indebted companies permanently diluting shareholders because lenders force them to raise capital at a distressed price. Of course, the upside of debt is that it often represents cheap capital, especially when it replaces dilution in a company with the ability to reinvest at high rates of return. When we think about a company's use of debt, we first look at cash and debt together.
Check out our latest analysis for Sanan OptoelectronicsLtd
How Much Debt Does Sanan OptoelectronicsLtd Carry?
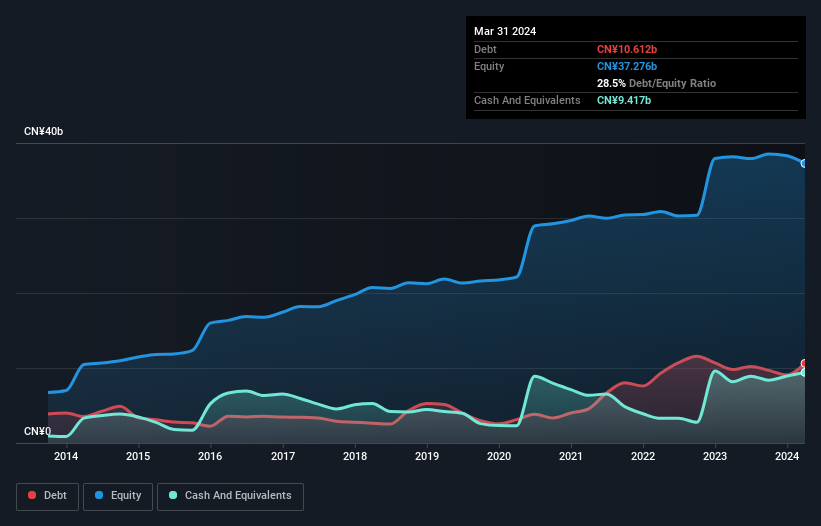
The image below, which you can click on for greater detail, shows that at March 2024 Sanan OptoelectronicsLtd had debt of CN¥10.6b, up from CN¥9.79b in one year. On the flip side, it has CN¥9.42b in cash leading to net debt of about CN¥1.19b.
A Look At Sanan OptoelectronicsLtd's Liabilities
We can see from the most recent balance sheet that Sanan OptoelectronicsLtd had liabilities of CN¥11.7b falling due within a year, and liabilities of CN¥8.73b due beyond that. On the other hand, it had cash of CN¥9.42b and CN¥5.94b worth of receivables due within a year. So its liabilities outweigh the sum of its cash and (near-term) receivables by CN¥5.11b.
Of course, Sanan OptoelectronicsLtd has a market capitalization of CN¥53.8b, so these liabilities are probably manageable. But there are sufficient liabilities that we would certainly recommend shareholders continue to monitor the balance sheet, going forward. When analysing debt levels, the balance sheet is the obvious place to start. But ultimately the future profitability of the business will decide if Sanan OptoelectronicsLtd can strengthen its balance sheet over time. So if you want to see what the professionals think, you might find this free report on analyst profit forecasts to be interesting.
Over 12 months, Sanan OptoelectronicsLtd reported revenue of CN¥15b, which is a gain of 13%, although it did not report any earnings before interest and tax. We usually like to see faster growth from unprofitable companies, but each to their own.
Caveat Emptor
Over the last twelve months Sanan OptoelectronicsLtd produced an earnings before interest and tax (EBIT) loss. To be specific the EBIT loss came in at CN¥1.0b. When we look at that and recall the liabilities on its balance sheet, relative to cash, it seems unwise to us for the company to have any debt. So we think its balance sheet is a little strained, though not beyond repair. Surprisingly, we note that it actually reported positive free cash flow of CN¥2.0b and a profit of CN¥272m. So one might argue that there's still a chance it can get things on the right track. The balance sheet is clearly the area to focus on when you are analysing debt. However, not all investment risk resides within the balance sheet - far from it. We've identified 2 warning signs with Sanan OptoelectronicsLtd , and understanding them should be part of your investment process.
When all is said and done, sometimes its easier to focus on companies that don't even need debt. Readers can access a list of growth stocks with zero net debt 100% free, right now.
New: Manage All Your Stock Portfolios in One Place
We've created the ultimate portfolio companion for stock investors, and it's free.
• Connect an unlimited number of Portfolios and see your total in one currency
• Be alerted to new Warning Signs or Risks via email or mobile
• Track the Fair Value of your stocks
Have feedback on this article? Concerned about the content? Get in touch with us directly. Alternatively, email editorial-team (at) simplywallst.com.
This article by Simply Wall St is general in nature. We provide commentary based on historical data and analyst forecasts only using an unbiased methodology and our articles are not intended to be financial advice. It does not constitute a recommendation to buy or sell any stock, and does not take account of your objectives, or your financial situation. We aim to bring you long-term focused analysis driven by fundamental data. Note that our analysis may not factor in the latest price-sensitive company announcements or qualitative material. Simply Wall St has no position in any stocks mentioned.
About SHSE:600703
Sanan OptoelectronicsLtd
Engages in the research, development, production, and sale of LED epitaxial wafers and chips, compound semiconductors, semiconductor and communication chips, and sapphire substrates in China and internationally.
Reasonable growth potential with adequate balance sheet.
Similar Companies
Market Insights

Advertisement
Community Narratives

BMW cruising ahead with new EVs and premium models to boost revenue 5%
Fair Value €135.07|44.6% undervalued
UN
Community Contributor
EU#2 - From Humble Beginnings to Global Powerhouse
Fair Value DKK 851.04|46.4% undervalued
TO
Community Contributor