
Advertisement
- China
- /
- General Merchandise and Department Stores
- /
- SZSE:000715
Returns On Capital At Zhongxing Shenyang Commercial Building GroupLtd (SZSE:000715) Paint A Concerning Picture
Finding a business that has the potential to grow substantially is not easy, but it is possible if we look at a few key financial metrics. Ideally, a business will show two trends; firstly a growing return on capital employed (ROCE) and secondly, an increasing amount of capital employed. Ultimately, this demonstrates that it's a business that is reinvesting profits at increasing rates of return. Having said that, from a first glance at Zhongxing Shenyang Commercial Building GroupLtd (SZSE:000715) we aren't jumping out of our chairs at how returns are trending, but let's have a deeper look.
Return On Capital Employed (ROCE): What Is It?
If you haven't worked with ROCE before, it measures the 'return' (pre-tax profit) a company generates from capital employed in its business. To calculate this metric for Zhongxing Shenyang Commercial Building GroupLtd, this is the formula:
Return on Capital Employed = Earnings Before Interest and Tax (EBIT) ÷ (Total Assets - Current Liabilities)
0.061 = CN¥120m ÷ (CN¥2.6b - CN¥628m) (Based on the trailing twelve months to March 2024).
Therefore, Zhongxing Shenyang Commercial Building GroupLtd has an ROCE of 6.1%. In absolute terms, that's a low return, but it's much better than the Multiline Retail industry average of 4.6%.
Check out our latest analysis for Zhongxing Shenyang Commercial Building GroupLtd
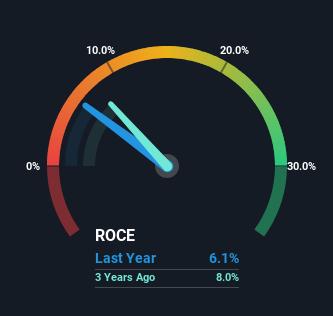
Above you can see how the current ROCE for Zhongxing Shenyang Commercial Building GroupLtd compares to its prior returns on capital, but there's only so much you can tell from the past. If you'd like, you can check out the forecasts from the analysts covering Zhongxing Shenyang Commercial Building GroupLtd for free.
What The Trend Of ROCE Can Tell Us
On the surface, the trend of ROCE at Zhongxing Shenyang Commercial Building GroupLtd doesn't inspire confidence. Over the last five years, returns on capital have decreased to 6.1% from 7.6% five years ago. However, given capital employed and revenue have both increased it appears that the business is currently pursuing growth, at the consequence of short term returns. If these investments prove successful, this can bode very well for long term stock performance.
In Conclusion...
In summary, despite lower returns in the short term, we're encouraged to see that Zhongxing Shenyang Commercial Building GroupLtd is reinvesting for growth and has higher sales as a result. However, despite the promising trends, the stock has fallen 10% over the last five years, so there might be an opportunity here for astute investors. As a result, we'd recommend researching this stock further to uncover what other fundamentals of the business can show us.
If you'd like to know more about Zhongxing Shenyang Commercial Building GroupLtd, we've spotted 2 warning signs, and 1 of them is concerning.
While Zhongxing Shenyang Commercial Building GroupLtd may not currently earn the highest returns, we've compiled a list of companies that currently earn more than 25% return on equity. Check out this free list here.
Valuation is complex, but we're here to simplify it.
Discover if Zhongxing Shenyang Commercial Building GroupLtd might be undervalued or overvalued with our detailed analysis, featuring fair value estimates, potential risks, dividends, insider trades, and its financial condition.
Access Free AnalysisHave feedback on this article? Concerned about the content? Get in touch with us directly. Alternatively, email editorial-team (at) simplywallst.com.
This article by Simply Wall St is general in nature. We provide commentary based on historical data and analyst forecasts only using an unbiased methodology and our articles are not intended to be financial advice. It does not constitute a recommendation to buy or sell any stock, and does not take account of your objectives, or your financial situation. We aim to bring you long-term focused analysis driven by fundamental data. Note that our analysis may not factor in the latest price-sensitive company announcements or qualitative material. Simply Wall St has no position in any stocks mentioned.
Have feedback on this article? Concerned about the content? Get in touch with us directly. Alternatively, email editorial-team@simplywallst.com
About SZSE:000715
Zhongxing Shenyang Commercial Building GroupLtd
Operates department stores, supermarkets, and online shopping platforms in China.
Excellent balance sheet with proven track record and pays a dividend.
Market Insights

Advertisement
Community Narratives
MicroVision will explode future revenue by 380.37% with a vision towards success
Fair Value US$60|98.4% undervalued
TH
Community Contributor
The Indispensable Artery for a New North American Economy
Fair Value CA$132.87|0.8% undervalued
TI
Community Contributor
Recently Updated Narratives
RE

RecMag on Proximus ·
Proximus: The State-Backed Backup Plan with 7% Gross Yield and 15% Currency Upside.
Fair Value:€17.1356.7% undervalued
29 followersusers have followed this narrative
0 commentsusers have commented on this narrative
0 likesusers have liked this narrative
SW

swift11 on DXC Technology ·
CEO: We are winners in the long term in the AI world
Fair Value:US$17.4624.9% undervalued
1 followerusers have followed this narrative
0 commentsusers have commented on this narrative
0 likesusers have liked this narrative
AL

AlexLovell on Rocket Lab ·
Early mover in a fast growing industry. Likely to experience share price volatility as they scale
Fair Value:US$16.25158.0% overvalued
2 followersusers have followed this narrative
0 commentsusers have commented on this narrative
0 likesusers have liked this narrative
Popular Narratives
TH

TheWallstreetKing on MicroVision ·
MicroVision will explode future revenue by 380.37% with a vision towards success
Fair Value:US$6098.4% undervalued
101 followersusers have followed this narrative
10 commentsusers have commented on this narrative
20 likesusers have liked this narrative
OS


oscargarcia on Alphabet ·
The company that turned a verb into a global necessity and basically runs the modern internet, digital ads, smartphones, maps, and AI.
Fair Value:US$3405.9% undervalued
137 followersusers have followed this narrative
6 commentsusers have commented on this narrative
18 likesusers have liked this narrative
AN


AnalystConsensusTarget on NVIDIA ·
NVDA: Expanding AI Demand Will Drive Major Data Center Investments Through 2026
Fair Value:US$232.7922.6% undervalued
929 followersusers have followed this narrative
6 commentsusers have commented on this narrative
22 likesusers have liked this narrative