
Advertisement
- China
- /
- General Merchandise and Department Stores
- /
- SZSE:000564
Would Ccoop Group (SZSE:000564) Be Better Off With Less Debt?

David Iben put it well when he said, 'Volatility is not a risk we care about. What we care about is avoiding the permanent loss of capital.' So it might be obvious that you need to consider debt, when you think about how risky any given stock is, because too much debt can sink a company. As with many other companies Ccoop Group Co., Ltd (SZSE:000564) makes use of debt. But the more important question is: how much risk is that debt creating?
Why Does Debt Bring Risk?
Debt assists a business until the business has trouble paying it off, either with new capital or with free cash flow. In the worst case scenario, a company can go bankrupt if it cannot pay its creditors. While that is not too common, we often do see indebted companies permanently diluting shareholders because lenders force them to raise capital at a distressed price. Having said that, the most common situation is where a company manages its debt reasonably well - and to its own advantage. When we examine debt levels, we first consider both cash and debt levels, together.
Check out our latest analysis for Ccoop Group
How Much Debt Does Ccoop Group Carry?
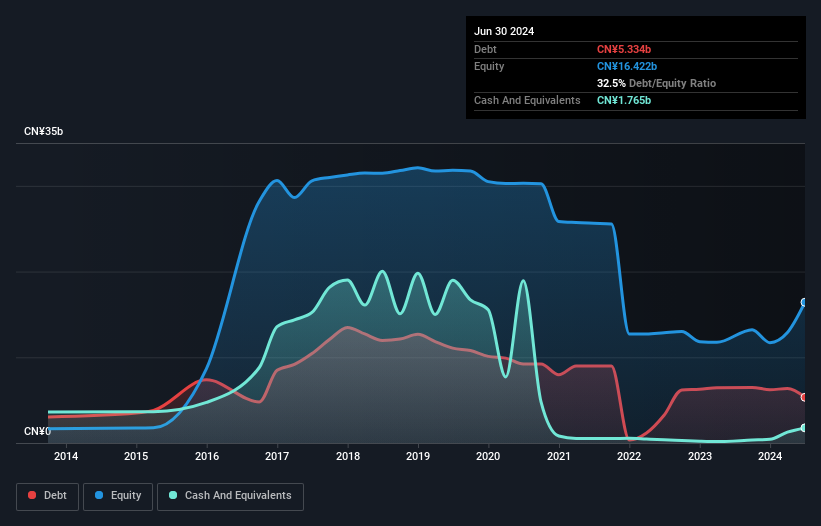
The image below, which you can click on for greater detail, shows that Ccoop Group had debt of CN¥5.33b at the end of June 2024, a reduction from CN¥6.49b over a year. However, it also had CN¥1.77b in cash, and so its net debt is CN¥3.57b.
A Look At Ccoop Group's Liabilities
The latest balance sheet data shows that Ccoop Group had liabilities of CN¥4.51b due within a year, and liabilities of CN¥10.1b falling due after that. On the other hand, it had cash of CN¥1.77b and CN¥260.2m worth of receivables due within a year. So its liabilities outweigh the sum of its cash and (near-term) receivables by CN¥12.6b.
Ccoop Group has a market capitalization of CN¥34.9b, so it could very likely raise cash to ameliorate its balance sheet, if the need arose. But we definitely want to keep our eyes open to indications that its debt is bringing too much risk. There's no doubt that we learn most about debt from the balance sheet. But you can't view debt in total isolation; since Ccoop Group will need earnings to service that debt. So when considering debt, it's definitely worth looking at the earnings trend. Click here for an interactive snapshot.
In the last year Ccoop Group wasn't profitable at an EBIT level, but managed to grow its revenue by 3.6%, to CN¥1.5b. That rate of growth is a bit slow for our taste, but it takes all types to make a world.
Caveat Emptor
Importantly, Ccoop Group had an earnings before interest and tax (EBIT) loss over the last year. To be specific the EBIT loss came in at CN¥936m. When we look at that and recall the liabilities on its balance sheet, relative to cash, it seems unwise to us for the company to have any debt. Quite frankly we think the balance sheet is far from match-fit, although it could be improved with time. However, it doesn't help that it burned through CN¥57m of cash over the last year. So suffice it to say we do consider the stock to be risky. When analysing debt levels, the balance sheet is the obvious place to start. But ultimately, every company can contain risks that exist outside of the balance sheet. For example - Ccoop Group has 1 warning sign we think you should be aware of.
Of course, if you're the type of investor who prefers buying stocks without the burden of debt, then don't hesitate to discover our exclusive list of net cash growth stocks, today.
New: AI Stock Screener & Alerts
Our new AI Stock Screener scans the market every day to uncover opportunities.
• Dividend Powerhouses (3%+ Yield)
• Undervalued Small Caps with Insider Buying
• High growth Tech and AI Companies
Or build your own from over 50 metrics.
Have feedback on this article? Concerned about the content? Get in touch with us directly. Alternatively, email editorial-team (at) simplywallst.com.
This article by Simply Wall St is general in nature. We provide commentary based on historical data and analyst forecasts only using an unbiased methodology and our articles are not intended to be financial advice. It does not constitute a recommendation to buy or sell any stock, and does not take account of your objectives, or your financial situation. We aim to bring you long-term focused analysis driven by fundamental data. Note that our analysis may not factor in the latest price-sensitive company announcements or qualitative material. Simply Wall St has no position in any stocks mentioned.
About SZSE:000564
Ccoop Group
Engages in the retail, supply and marketing, financial, and logistics business in China and internationally.
Mediocre balance sheet with weak fundamentals.
Similar Companies
Market Insights


Advertisement
Community Narratives
Alphabet: The Under-appreciated Compounder Hiding in Plain Sight
Fair Value US$282.83|32.8% undervalued
BL
Community Contributor
Planet Labs: At The Heart Of The Emerging New Space Boom
Fair Value US$11.31|45.4% undervalued
AN
Community Contributor
Exxon in Guyana 5 year forecast Low $135 to High $189
Fair Value US$174.00|37.0% undervalued
AG
Community Contributor