
Advertisement
- China
- /
- General Merchandise and Department Stores
- /
- SHSE:600859
Is Wangfujing Group Co., Ltd. (SHSE:600859) Trading At A 49% Discount?
Key Insights
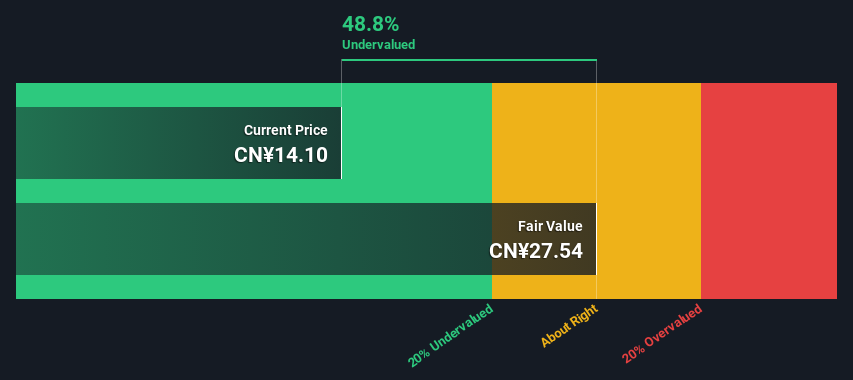
- Using the 2 Stage Free Cash Flow to Equity, Wangfujing Group fair value estimate is CN¥27.54
- Wangfujing Group is estimated to be 49% undervalued based on current share price of CN¥14.10
- Analyst price target for 600859 is CN¥17.60 which is 36% below our fair value estimate
Today we will run through one way of estimating the intrinsic value of Wangfujing Group Co., Ltd. (SHSE:600859) by estimating the company's future cash flows and discounting them to their present value. Our analysis will employ the Discounted Cash Flow (DCF) model. It may sound complicated, but actually it is quite simple!
We would caution that there are many ways of valuing a company and, like the DCF, each technique has advantages and disadvantages in certain scenarios. If you still have some burning questions about this type of valuation, take a look at the Simply Wall St analysis model.
See our latest analysis for Wangfujing Group
What's The Estimated Valuation?
We're using the 2-stage growth model, which simply means we take in account two stages of company's growth. In the initial period the company may have a higher growth rate and the second stage is usually assumed to have a stable growth rate. To begin with, we have to get estimates of the next ten years of cash flows. Where possible we use analyst estimates, but when these aren't available we extrapolate the previous free cash flow (FCF) from the last estimate or reported value. We assume companies with shrinking free cash flow will slow their rate of shrinkage, and that companies with growing free cash flow will see their growth rate slow, over this period. We do this to reflect that growth tends to slow more in the early years than it does in later years.
A DCF is all about the idea that a dollar in the future is less valuable than a dollar today, so we discount the value of these future cash flows to their estimated value in today's dollars:
10-year free cash flow (FCF) forecast
| 2025 | 2026 | 2027 | 2028 | 2029 | 2030 | 2031 | 2032 | 2033 | 2034 | |
| Levered FCF (CN¥, Millions) | CN¥1.54b | CN¥1.97b | CN¥2.09b | CN¥2.19b | CN¥2.29b | CN¥2.38b | CN¥2.47b | CN¥2.55b | CN¥2.64b | CN¥2.72b |
| Growth Rate Estimate Source | Analyst x1 | Analyst x1 | Est @ 6.15% | Est @ 5.16% | Est @ 4.47% | Est @ 3.98% | Est @ 3.64% | Est @ 3.41% | Est @ 3.24% | Est @ 3.12% |
| Present Value (CN¥, Millions) Discounted @ 9.4% | CN¥1.4k | CN¥1.6k | CN¥1.6k | CN¥1.5k | CN¥1.5k | CN¥1.4k | CN¥1.3k | CN¥1.2k | CN¥1.2k | CN¥1.1k |
("Est" = FCF growth rate estimated by Simply Wall St)
Present Value of 10-year Cash Flow (PVCF) = CN¥14b
We now need to calculate the Terminal Value, which accounts for all the future cash flows after this ten year period. The Gordon Growth formula is used to calculate Terminal Value at a future annual growth rate equal to the 5-year average of the 10-year government bond yield of 2.9%. We discount the terminal cash flows to today's value at a cost of equity of 9.4%.
Terminal Value (TV)= FCF2034 × (1 + g) ÷ (r – g) = CN¥2.7b× (1 + 2.9%) ÷ (9.4%– 2.9%) = CN¥43b
Present Value of Terminal Value (PVTV)= TV / (1 + r)10= CN¥43b÷ ( 1 + 9.4%)10= CN¥17b
The total value, or equity value, is then the sum of the present value of the future cash flows, which in this case is CN¥31b. To get the intrinsic value per share, we divide this by the total number of shares outstanding. Compared to the current share price of CN¥14.1, the company appears quite good value at a 49% discount to where the stock price trades currently. Valuations are imprecise instruments though, rather like a telescope - move a few degrees and end up in a different galaxy. Do keep this in mind.
Important Assumptions
Now the most important inputs to a discounted cash flow are the discount rate, and of course, the actual cash flows. Part of investing is coming up with your own evaluation of a company's future performance, so try the calculation yourself and check your own assumptions. The DCF also does not consider the possible cyclicality of an industry, or a company's future capital requirements, so it does not give a full picture of a company's potential performance. Given that we are looking at Wangfujing Group as potential shareholders, the cost of equity is used as the discount rate, rather than the cost of capital (or weighted average cost of capital, WACC) which accounts for debt. In this calculation we've used 9.4%, which is based on a levered beta of 1.315. Beta is a measure of a stock's volatility, compared to the market as a whole. We get our beta from the industry average beta of globally comparable companies, with an imposed limit between 0.8 and 2.0, which is a reasonable range for a stable business.
SWOT Analysis for Wangfujing Group
Strength
- Earnings growth over the past year exceeded the industry.
- Debt is not viewed as a risk.
- Dividends are covered by earnings and cash flows.
Weakness
- Dividend is low compared to the top 25% of dividend payers in the Multiline Retail market.
Opportunity
- Annual earnings are forecast to grow for the next 3 years.
- Trading below our estimate of fair value by more than 20%.
Threat
- Annual earnings are forecast to grow slower than the Chinese market.
Moving On:
Whilst important, the DCF calculation ideally won't be the sole piece of analysis you scrutinize for a company. The DCF model is not a perfect stock valuation tool. Rather it should be seen as a guide to "what assumptions need to be true for this stock to be under/overvalued?" For example, changes in the company's cost of equity or the risk free rate can significantly impact the valuation. What is the reason for the share price sitting below the intrinsic value? For Wangfujing Group, we've compiled three essential aspects you should further examine:
- Risks: For example, we've discovered 2 warning signs for Wangfujing Group that you should be aware of before investing here.
- Future Earnings: How does 600859's growth rate compare to its peers and the wider market? Dig deeper into the analyst consensus number for the upcoming years by interacting with our free analyst growth expectation chart.
- Other High Quality Alternatives: Do you like a good all-rounder? Explore our interactive list of high quality stocks to get an idea of what else is out there you may be missing!
PS. Simply Wall St updates its DCF calculation for every Chinese stock every day, so if you want to find the intrinsic value of any other stock just search here.
Valuation is complex, but we're here to simplify it.
Discover if Wangfujing Group might be undervalued or overvalued with our detailed analysis, featuring fair value estimates, potential risks, dividends, insider trades, and its financial condition.
Access Free AnalysisHave feedback on this article? Concerned about the content? Get in touch with us directly. Alternatively, email editorial-team (at) simplywallst.com.
This article by Simply Wall St is general in nature. We provide commentary based on historical data and analyst forecasts only using an unbiased methodology and our articles are not intended to be financial advice. It does not constitute a recommendation to buy or sell any stock, and does not take account of your objectives, or your financial situation. We aim to bring you long-term focused analysis driven by fundamental data. Note that our analysis may not factor in the latest price-sensitive company announcements or qualitative material. Simply Wall St has no position in any stocks mentioned.
About SHSE:600859
Adequate balance sheet with moderate growth potential.
Similar Companies
Market Insights

Advertisement
Community Narratives
Quality at a Premium. A time to watch, not to buy?
Fair Value US$154.56|27.6% undervalued
DA
Community Contributor
GRAB: The Super-App at the Heart of Southeast Asia’s Digital Boom
Fair Value US$8.20|22.1% undervalued
BL
Community Contributor
Verve Group to Surge with 51.61% Revenue Growth
Fair Value €6.00|60.0% undervalued
ME
Community Contributor