
Advertisement
- China
- /
- General Merchandise and Department Stores
- /
- SHSE:600785
Why Investors Shouldn't Be Surprised By Yinchuan Xinhua Commercial (Group) Co., Ltd.'s (SHSE:600785) 25% Share Price Plunge

Unfortunately for some shareholders, the Yinchuan Xinhua Commercial (Group) Co., Ltd. (SHSE:600785) share price has dived 25% in the last thirty days, prolonging recent pain. The drop over the last 30 days has capped off a tough year for shareholders, with the share price down 33% in that time.
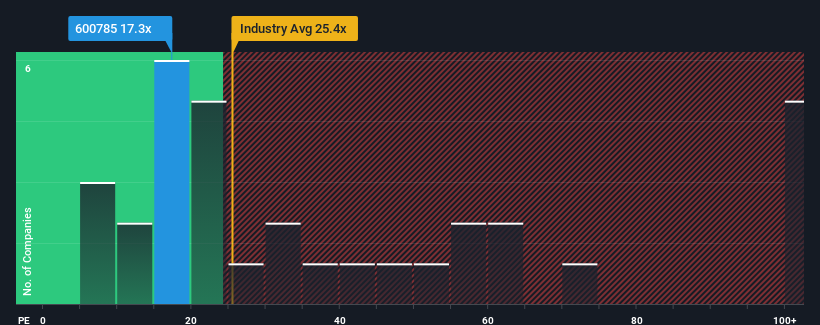
After such a large drop in price, Yinchuan Xinhua Commercial (Group)'s price-to-earnings (or "P/E") ratio of 17.3x might make it look like a buy right now compared to the market in China, where around half of the companies have P/E ratios above 29x and even P/E's above 55x are quite common. However, the P/E might be low for a reason and it requires further investigation to determine if it's justified.
There hasn't been much to differentiate Yinchuan Xinhua Commercial (Group)'s and the market's earnings growth lately. One possibility is that the P/E is low because investors think this modest earnings performance may begin to slide. If not, then existing shareholders have reason to be optimistic about the future direction of the share price.
Check out our latest analysis for Yinchuan Xinhua Commercial (Group)
What Are Growth Metrics Telling Us About The Low P/E?
Yinchuan Xinhua Commercial (Group)'s P/E ratio would be typical for a company that's only expected to deliver limited growth, and importantly, perform worse than the market.
Retrospectively, the last year delivered virtually the same number to the company's bottom line as the year before. However, a few strong years before that means that it was still able to grow EPS by an impressive 250% in total over the last three years. Accordingly, shareholders would have probably welcomed those medium-term rates of earnings growth.
Turning to the outlook, the next three years should generate growth of 11% each year as estimated by the only analyst watching the company. That's shaping up to be materially lower than the 24% each year growth forecast for the broader market.
In light of this, it's understandable that Yinchuan Xinhua Commercial (Group)'s P/E sits below the majority of other companies. Apparently many shareholders weren't comfortable holding on while the company is potentially eyeing a less prosperous future.
The Final Word
Yinchuan Xinhua Commercial (Group)'s P/E has taken a tumble along with its share price. Generally, our preference is to limit the use of the price-to-earnings ratio to establishing what the market thinks about the overall health of a company.
We've established that Yinchuan Xinhua Commercial (Group) maintains its low P/E on the weakness of its forecast growth being lower than the wider market, as expected. At this stage investors feel the potential for an improvement in earnings isn't great enough to justify a higher P/E ratio. It's hard to see the share price rising strongly in the near future under these circumstances.
There are also other vital risk factors to consider before investing and we've discovered 1 warning sign for Yinchuan Xinhua Commercial (Group) that you should be aware of.
If these risks are making you reconsider your opinion on Yinchuan Xinhua Commercial (Group), explore our interactive list of high quality stocks to get an idea of what else is out there.
New: Manage All Your Stock Portfolios in One Place
We've created the ultimate portfolio companion for stock investors, and it's free.
• Connect an unlimited number of Portfolios and see your total in one currency
• Be alerted to new Warning Signs or Risks via email or mobile
• Track the Fair Value of your stocks
Have feedback on this article? Concerned about the content? Get in touch with us directly. Alternatively, email editorial-team (at) simplywallst.com.
This article by Simply Wall St is general in nature. We provide commentary based on historical data and analyst forecasts only using an unbiased methodology and our articles are not intended to be financial advice. It does not constitute a recommendation to buy or sell any stock, and does not take account of your objectives, or your financial situation. We aim to bring you long-term focused analysis driven by fundamental data. Note that our analysis may not factor in the latest price-sensitive company announcements or qualitative material. Simply Wall St has no position in any stocks mentioned.
Have feedback on this article? Concerned about the content? Get in touch with us directly. Alternatively, email editorial-team@simplywallst.com
About SHSE:600785
Yinchuan Xinhua Commercial (Group)
Yinchuan Xinhua Commercial (Group) Co., Ltd.
Good value with adequate balance sheet.
Market Insights

Advertisement
Community Narratives

BMW cruising ahead with new EVs and premium models to boost revenue 5%
Fair Value €135.07|43.5% undervalued
UN
Community Contributor
EU#2 - From Humble Beginnings to Global Powerhouse
Fair Value DKK 851.04|51.3% undervalued
TO
Community Contributor