- China
- /
- Retail Distributors
- /
- SHSE:600626
Subdued Growth No Barrier To Shanghai Shenda Co., Ltd (SHSE:600626) With Shares Advancing 28%


Shanghai Shenda Co., Ltd (SHSE:600626) shareholders would be excited to see that the share price has had a great month, posting a 28% gain and recovering from prior weakness. Unfortunately, the gains of the last month did little to right the losses of the last year with the stock still down 19% over that time.
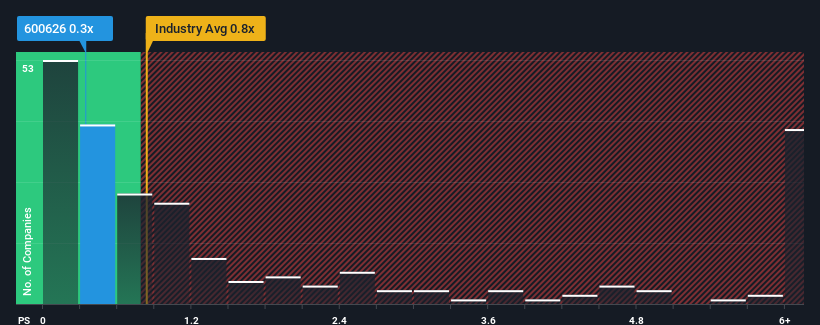
In spite of the firm bounce in price, it's still not a stretch to say that Shanghai Shenda's price-to-sales (or "P/S") ratio of 0.3x right now seems quite "middle-of-the-road" compared to the Retail Distributors industry in China, seeing as it matches the P/S ratio of the wider industry. Although, it's not wise to simply ignore the P/S without explanation as investors may be disregarding a distinct opportunity or a costly mistake.
Check out our latest analysis for Shanghai Shenda
How Has Shanghai Shenda Performed Recently?
Shanghai Shenda has been doing a decent job lately as it's been growing revenue at a reasonable pace. One possibility is that the P/S is moderate because investors think this good revenue growth might only be parallel to the broader industry in the near future. Those who are bullish on Shanghai Shenda will be hoping that this isn't the case, so that they can pick up the stock at a lower valuation.
Want the full picture on earnings, revenue and cash flow for the company? Then our free report on Shanghai Shenda will help you shine a light on its historical performance.What Are Revenue Growth Metrics Telling Us About The P/S?
In order to justify its P/S ratio, Shanghai Shenda would need to produce growth that's similar to the industry.
Taking a look back first, we see that the company managed to grow revenues by a handy 4.3% last year. Revenue has also lifted 10% in aggregate from three years ago, partly thanks to the last 12 months of growth. Accordingly, shareholders would have probably been satisfied with the medium-term rates of revenue growth.
Comparing that to the industry, which is predicted to deliver 31% growth in the next 12 months, the company's momentum is weaker, based on recent medium-term annualised revenue results.
With this information, we find it interesting that Shanghai Shenda is trading at a fairly similar P/S compared to the industry. Apparently many investors in the company are less bearish than recent times would indicate and aren't willing to let go of their stock right now. Maintaining these prices will be difficult to achieve as a continuation of recent revenue trends is likely to weigh down the shares eventually.
What We Can Learn From Shanghai Shenda's P/S?
Its shares have lifted substantially and now Shanghai Shenda's P/S is back within range of the industry median. Using the price-to-sales ratio alone to determine if you should sell your stock isn't sensible, however it can be a practical guide to the company's future prospects.
Our examination of Shanghai Shenda revealed its poor three-year revenue trends aren't resulting in a lower P/S as per our expectations, given they look worse than current industry outlook. Right now we are uncomfortable with the P/S as this revenue performance isn't likely to support a more positive sentiment for long. Unless the recent medium-term conditions improve, it's hard to accept the current share price as fair value.
It is also worth noting that we have found 2 warning signs for Shanghai Shenda (1 is a bit unpleasant!) that you need to take into consideration.
If strong companies turning a profit tickle your fancy, then you'll want to check out this free list of interesting companies that trade on a low P/E (but have proven they can grow earnings).
If you're looking to trade Shanghai Shenda, open an account with the lowest-cost platform trusted by professionals, Interactive Brokers.
With clients in over 200 countries and territories, and access to 160 markets, IBKR lets you trade stocks, options, futures, forex, bonds and funds from a single integrated account.
Enjoy no hidden fees, no account minimums, and FX conversion rates as low as 0.03%, far better than what most brokers offer.
Sponsored ContentNew: Manage All Your Stock Portfolios in One Place
We've created the ultimate portfolio companion for stock investors, and it's free.
• Connect an unlimited number of Portfolios and see your total in one currency
• Be alerted to new Warning Signs or Risks via email or mobile
• Track the Fair Value of your stocks
Have feedback on this article? Concerned about the content? Get in touch with us directly. Alternatively, email editorial-team (at) simplywallst.com.
This article by Simply Wall St is general in nature. We provide commentary based on historical data and analyst forecasts only using an unbiased methodology and our articles are not intended to be financial advice. It does not constitute a recommendation to buy or sell any stock, and does not take account of your objectives, or your financial situation. We aim to bring you long-term focused analysis driven by fundamental data. Note that our analysis may not factor in the latest price-sensitive company announcements or qualitative material. Simply Wall St has no position in any stocks mentioned.
Have feedback on this article? Concerned about the content? Get in touch with us directly. Alternatively, email editorial-team@simplywallst.com
About SHSE:600626
Shanghai Shenda
Engages in the import and export trading of textile products in China.
Good value with mediocre balance sheet.
Market Insights

Community Narratives

