- China
- /
- Specialty Stores
- /
- SHSE:600398
Hla Group Corp., Ltd. (SHSE:600398) Shares Could Be 28% Below Their Intrinsic Value Estimate

Key Insights
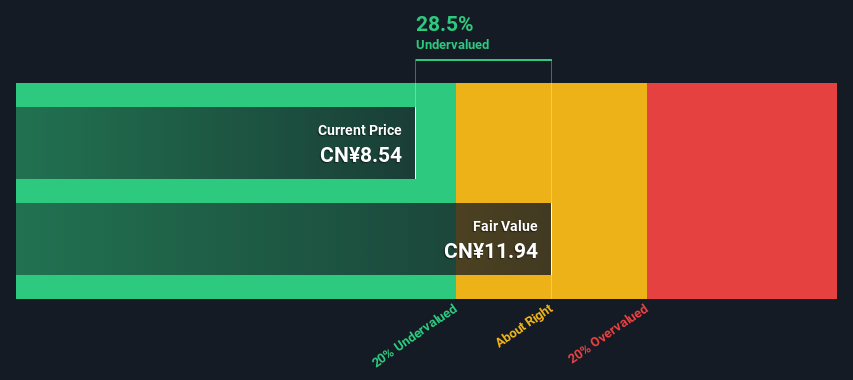
- The projected fair value for Hla Group is CN¥11.94 based on 2 Stage Free Cash Flow to Equity
- Hla Group's CN¥8.54 share price signals that it might be 28% undervalued
- The CN¥8.71 analyst price target for 600398 is 27% less than our estimate of fair value
In this article we are going to estimate the intrinsic value of Hla Group Corp., Ltd. (SHSE:600398) by estimating the company's future cash flows and discounting them to their present value. One way to achieve this is by employing the Discounted Cash Flow (DCF) model. Before you think you won't be able to understand it, just read on! It's actually much less complex than you'd imagine.
We would caution that there are many ways of valuing a company and, like the DCF, each technique has advantages and disadvantages in certain scenarios. If you want to learn more about discounted cash flow, the rationale behind this calculation can be read in detail in the Simply Wall St analysis model.
Check out our latest analysis for Hla Group
The Calculation
We use what is known as a 2-stage model, which simply means we have two different periods of growth rates for the company's cash flows. Generally the first stage is higher growth, and the second stage is a lower growth phase. In the first stage we need to estimate the cash flows to the business over the next ten years. Where possible we use analyst estimates, but when these aren't available we extrapolate the previous free cash flow (FCF) from the last estimate or reported value. We assume companies with shrinking free cash flow will slow their rate of shrinkage, and that companies with growing free cash flow will see their growth rate slow, over this period. We do this to reflect that growth tends to slow more in the early years than it does in later years.
A DCF is all about the idea that a dollar in the future is less valuable than a dollar today, so we need to discount the sum of these future cash flows to arrive at a present value estimate:
10-year free cash flow (FCF) estimate
| 2024 | 2025 | 2026 | 2027 | 2028 | 2029 | 2030 | 2031 | 2032 | 2033 | |
| Levered FCF (CN¥, Millions) | CN¥3.17b | CN¥3.80b | CN¥3.70b | CN¥3.66b | CN¥3.67b | CN¥3.71b | CN¥3.77b | CN¥3.84b | CN¥3.93b | CN¥4.03b |
| Growth Rate Estimate Source | Analyst x2 | Analyst x2 | Est @ -2.62% | Est @ -0.95% | Est @ 0.21% | Est @ 1.03% | Est @ 1.60% | Est @ 2.00% | Est @ 2.29% | Est @ 2.48% |
| Present Value (CN¥, Millions) Discounted @ 9.0% | CN¥2.9k | CN¥3.2k | CN¥2.9k | CN¥2.6k | CN¥2.4k | CN¥2.2k | CN¥2.1k | CN¥1.9k | CN¥1.8k | CN¥1.7k |
("Est" = FCF growth rate estimated by Simply Wall St)
Present Value of 10-year Cash Flow (PVCF) = CN¥24b
After calculating the present value of future cash flows in the initial 10-year period, we need to calculate the Terminal Value, which accounts for all future cash flows beyond the first stage. For a number of reasons a very conservative growth rate is used that cannot exceed that of a country's GDP growth. In this case we have used the 5-year average of the 10-year government bond yield (2.9%) to estimate future growth. In the same way as with the 10-year 'growth' period, we discount future cash flows to today's value, using a cost of equity of 9.0%.
Terminal Value (TV)= FCF2033 × (1 + g) ÷ (r – g) = CN¥4.0b× (1 + 2.9%) ÷ (9.0%– 2.9%) = CN¥68b
Present Value of Terminal Value (PVTV)= TV / (1 + r)10= CN¥68b÷ ( 1 + 9.0%)10= CN¥29b
The total value, or equity value, is then the sum of the present value of the future cash flows, which in this case is CN¥52b. In the final step we divide the equity value by the number of shares outstanding. Relative to the current share price of CN¥8.5, the company appears a touch undervalued at a 28% discount to where the stock price trades currently. Remember though, that this is just an approximate valuation, and like any complex formula - garbage in, garbage out.
Important Assumptions
We would point out that the most important inputs to a discounted cash flow are the discount rate and of course the actual cash flows. Part of investing is coming up with your own evaluation of a company's future performance, so try the calculation yourself and check your own assumptions. The DCF also does not consider the possible cyclicality of an industry, or a company's future capital requirements, so it does not give a full picture of a company's potential performance. Given that we are looking at Hla Group as potential shareholders, the cost of equity is used as the discount rate, rather than the cost of capital (or weighted average cost of capital, WACC) which accounts for debt. In this calculation we've used 9.0%, which is based on a levered beta of 1.082. Beta is a measure of a stock's volatility, compared to the market as a whole. We get our beta from the industry average beta of globally comparable companies, with an imposed limit between 0.8 and 2.0, which is a reasonable range for a stable business.
SWOT Analysis for Hla Group
- Earnings growth over the past year exceeded the industry.
- Debt is not viewed as a risk.
- Dividends are covered by earnings and cash flows.
- Dividend is in the top 25% of dividend payers in the market.
- No major weaknesses identified for 600398.
- Annual earnings are forecast to grow for the next 3 years.
- Good value based on P/E ratio and estimated fair value.
- Annual earnings are forecast to grow slower than the Chinese market.
Looking Ahead:
Although the valuation of a company is important, it ideally won't be the sole piece of analysis you scrutinize for a company. DCF models are not the be-all and end-all of investment valuation. Rather it should be seen as a guide to "what assumptions need to be true for this stock to be under/overvalued?" For instance, if the terminal value growth rate is adjusted slightly, it can dramatically alter the overall result. Can we work out why the company is trading at a discount to intrinsic value? For Hla Group, there are three important elements you should further research:
- Risks: For example, we've discovered 1 warning sign for Hla Group that you should be aware of before investing here.
- Future Earnings: How does 600398's growth rate compare to its peers and the wider market? Dig deeper into the analyst consensus number for the upcoming years by interacting with our free analyst growth expectation chart.
- Other High Quality Alternatives: Do you like a good all-rounder? Explore our interactive list of high quality stocks to get an idea of what else is out there you may be missing!
PS. The Simply Wall St app conducts a discounted cash flow valuation for every stock on the SHSE every day. If you want to find the calculation for other stocks just search here.
Valuation is complex, but we're here to simplify it.
Discover if Hla Group might be undervalued or overvalued with our detailed analysis, featuring fair value estimates, potential risks, dividends, insider trades, and its financial condition.
Access Free AnalysisHave feedback on this article? Concerned about the content? Get in touch with us directly. Alternatively, email editorial-team (at) simplywallst.com.
This article by Simply Wall St is general in nature. We provide commentary based on historical data and analyst forecasts only using an unbiased methodology and our articles are not intended to be financial advice. It does not constitute a recommendation to buy or sell any stock, and does not take account of your objectives, or your financial situation. We aim to bring you long-term focused analysis driven by fundamental data. Note that our analysis may not factor in the latest price-sensitive company announcements or qualitative material. Simply Wall St has no position in any stocks mentioned.
About SHSE:600398
Hla Group
Manufactures and sells menswear, womenswear, kids, professional, and home furnishing products in China.
Flawless balance sheet and undervalued.
Similar Companies
Market Insights

Community Narratives


