
Advertisement
- China
- /
- Real Estate
- /
- SZSE:000965
Investors Still Aren't Entirely Convinced By Tianjin Tianbao Infrastructure Co., Ltd.'s (SZSE:000965) Revenues Despite 39% Price Jump
Tianjin Tianbao Infrastructure Co., Ltd. (SZSE:000965) shareholders have had their patience rewarded with a 39% share price jump in the last month. Unfortunately, the gains of the last month did little to right the losses of the last year with the stock still down 13% over that time.
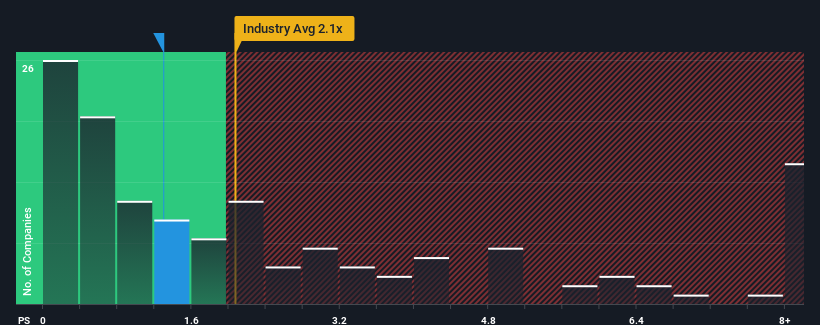
Even after such a large jump in price, Tianjin Tianbao Infrastructure's price-to-sales (or "P/S") ratio of 1.3x might still make it look like a buy right now compared to the Real Estate industry in China, where around half of the companies have P/S ratios above 2.1x and even P/S above 5x are quite common. Although, it's not wise to just take the P/S at face value as there may be an explanation why it's limited.
Check out our latest analysis for Tianjin Tianbao Infrastructure
How Tianjin Tianbao Infrastructure Has Been Performing
Tianjin Tianbao Infrastructure certainly has been doing a great job lately as it's been growing its revenue at a really rapid pace. It might be that many expect the strong revenue performance to degrade substantially, which has repressed the P/S ratio. If you like the company, you'd be hoping this isn't the case so that you could potentially pick up some stock while it's out of favour.
We don't have analyst forecasts, but you can see how recent trends are setting up the company for the future by checking out our free report on Tianjin Tianbao Infrastructure's earnings, revenue and cash flow.Do Revenue Forecasts Match The Low P/S Ratio?
Tianjin Tianbao Infrastructure's P/S ratio would be typical for a company that's only expected to deliver limited growth, and importantly, perform worse than the industry.
If we review the last year of revenue growth, the company posted a terrific increase of 37%. The latest three year period has also seen an incredible overall rise in revenue, aided by its incredible short-term performance. So we can start by confirming that the company has done a tremendous job of growing revenue over that time.
Comparing that recent medium-term revenue trajectory with the industry's one-year growth forecast of 5.5% shows it's noticeably more attractive.
With this information, we find it odd that Tianjin Tianbao Infrastructure is trading at a P/S lower than the industry. It looks like most investors are not convinced the company can maintain its recent growth rates.
The Final Word
The latest share price surge wasn't enough to lift Tianjin Tianbao Infrastructure's P/S close to the industry median. Generally, our preference is to limit the use of the price-to-sales ratio to establishing what the market thinks about the overall health of a company.
We're very surprised to see Tianjin Tianbao Infrastructure currently trading on a much lower than expected P/S since its recent three-year growth is higher than the wider industry forecast. When we see robust revenue growth that outpaces the industry, we presume that there are notable underlying risks to the company's future performance, which is exerting downward pressure on the P/S ratio. While recent revenue trends over the past medium-term suggest that the risk of a price decline is low, investors appear to perceive a likelihood of revenue fluctuations in the future.
You always need to take note of risks, for example - Tianjin Tianbao Infrastructure has 3 warning signs we think you should be aware of.
It's important to make sure you look for a great company, not just the first idea you come across. So if growing profitability aligns with your idea of a great company, take a peek at this free list of interesting companies with strong recent earnings growth (and a low P/E).
Valuation is complex, but we're here to simplify it.
Discover if Tianjin Tianbao Infrastructure might be undervalued or overvalued with our detailed analysis, featuring fair value estimates, potential risks, dividends, insider trades, and its financial condition.
Access Free AnalysisHave feedback on this article? Concerned about the content? Get in touch with us directly. Alternatively, email editorial-team (at) simplywallst.com.
This article by Simply Wall St is general in nature. We provide commentary based on historical data and analyst forecasts only using an unbiased methodology and our articles are not intended to be financial advice. It does not constitute a recommendation to buy or sell any stock, and does not take account of your objectives, or your financial situation. We aim to bring you long-term focused analysis driven by fundamental data. Note that our analysis may not factor in the latest price-sensitive company announcements or qualitative material. Simply Wall St has no position in any stocks mentioned.
About SZSE:000965
Tianjin Tianbao Infrastructure
Engages in the real estate development, property leasing, property management, and other businesses in China.
Low risk with imperfect balance sheet.
Market Insights

Advertisement
Community Narratives
MicroVision will explode future revenue by 380.37% with a vision towards success
Fair Value US$60|98.4% undervalued
TH
Community Contributor
The Indispensable Artery for a New North American Economy
Fair Value CA$132.87|0.8% undervalued
TI
Community Contributor
Recently Updated Narratives
AL

AlexLovell on Rocket Lab ·
Early mover in a fast growing industry. Likely to experience share price volatility as they scale
Fair Value:US$16.25158.0% overvalued
1 followerusers have followed this narrative
0 commentsusers have commented on this narrative
0 likesusers have liked this narrative
MA


MarkoVT on ANYCOLOR ·
Near zero debt, Japan centric focus provides future growth
Fair Value:JP¥7.61k15.3% undervalued
1 followerusers have followed this narrative
0 commentsusers have commented on this narrative
0 likesusers have liked this narrative
CO

composite32 on TAV Havalimanlari Holding ·
TAV Havalimanlari Holding will fly high with 25.68% revenue growth
Fair Value:₺545.1648.6% undervalued
3 followersusers have followed this narrative
0 commentsusers have commented on this narrative
0 likesusers have liked this narrative
Popular Narratives
TH

TheWallstreetKing on MicroVision ·
MicroVision will explode future revenue by 380.37% with a vision towards success
Fair Value:US$6098.4% undervalued
96 followersusers have followed this narrative
10 commentsusers have commented on this narrative
19 likesusers have liked this narrative
OS


oscargarcia on Alphabet ·
The company that turned a verb into a global necessity and basically runs the modern internet, digital ads, smartphones, maps, and AI.
Fair Value:US$3405.9% undervalued
137 followersusers have followed this narrative
6 commentsusers have commented on this narrative
18 likesusers have liked this narrative
AN


AnalystConsensusTarget on NVIDIA ·
NVDA: Expanding AI Demand Will Drive Major Data Center Investments Through 2026
Fair Value:US$232.7922.6% undervalued
929 followersusers have followed this narrative
6 commentsusers have commented on this narrative
22 likesusers have liked this narrative