- China
- /
- Real Estate
- /
- SHSE:600692
Optimistic Investors Push Shang Hai Ya Tong Co.,Ltd. (SHSE:600692) Shares Up 26% But Growth Is Lacking


Shang Hai Ya Tong Co.,Ltd. (SHSE:600692) shares have continued their recent momentum with a 26% gain in the last month alone. Unfortunately, despite the strong performance over the last month, the full year gain of 8.6% isn't as attractive.
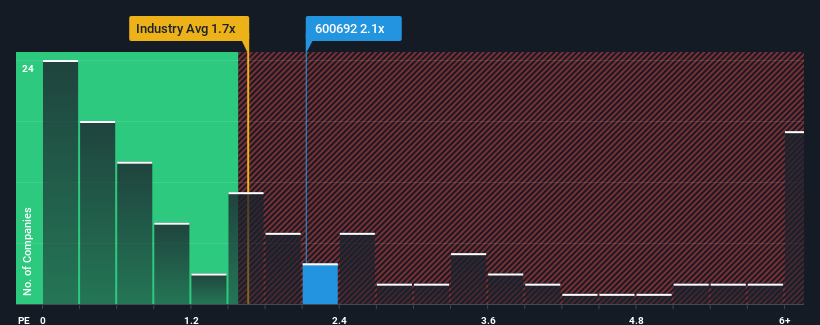
In spite of the firm bounce in price, there still wouldn't be many who think Shang Hai Ya TongLtd's price-to-sales (or "P/S") ratio of 2.1x is worth a mention when the median P/S in China's Real Estate industry is similar at about 1.7x. Although, it's not wise to simply ignore the P/S without explanation as investors may be disregarding a distinct opportunity or a costly mistake.
See our latest analysis for Shang Hai Ya TongLtd
How Shang Hai Ya TongLtd Has Been Performing
For instance, Shang Hai Ya TongLtd's receding revenue in recent times would have to be some food for thought. Perhaps investors believe the recent revenue performance is enough to keep in line with the industry, which is keeping the P/S from dropping off. If not, then existing shareholders may be a little nervous about the viability of the share price.
Want the full picture on earnings, revenue and cash flow for the company? Then our free report on Shang Hai Ya TongLtd will help you shine a light on its historical performance.Is There Some Revenue Growth Forecasted For Shang Hai Ya TongLtd?
There's an inherent assumption that a company should be matching the industry for P/S ratios like Shang Hai Ya TongLtd's to be considered reasonable.
Taking a look back first, the company's revenue growth last year wasn't something to get excited about as it posted a disappointing decline of 7.5%. Unfortunately, that's brought it right back to where it started three years ago with revenue growth being virtually non-existent overall during that time. So it appears to us that the company has had a mixed result in terms of growing revenue over that time.
Comparing that to the industry, which is predicted to deliver 8.6% growth in the next 12 months, the company's downward momentum based on recent medium-term revenue results is a sobering picture.
With this information, we find it concerning that Shang Hai Ya TongLtd is trading at a fairly similar P/S compared to the industry. Apparently many investors in the company are way less bearish than recent times would indicate and aren't willing to let go of their stock right now. There's a good chance existing shareholders are setting themselves up for future disappointment if the P/S falls to levels more in line with the recent negative growth rates.
What Does Shang Hai Ya TongLtd's P/S Mean For Investors?
Shang Hai Ya TongLtd appears to be back in favour with a solid price jump bringing its P/S back in line with other companies in the industry While the price-to-sales ratio shouldn't be the defining factor in whether you buy a stock or not, it's quite a capable barometer of revenue expectations.
The fact that Shang Hai Ya TongLtd currently trades at a P/S on par with the rest of the industry is surprising to us since its recent revenues have been in decline over the medium-term, all while the industry is set to grow. Even though it matches the industry, we're uncomfortable with the current P/S ratio, as this dismal revenue performance is unlikely to support a more positive sentiment for long. If recent medium-term revenue trends continue, it will place shareholders' investments at risk and potential investors in danger of paying an unnecessary premium.
Before you settle on your opinion, we've discovered 3 warning signs for Shang Hai Ya TongLtd (2 don't sit too well with us!) that you should be aware of.
If strong companies turning a profit tickle your fancy, then you'll want to check out this free list of interesting companies that trade on a low P/E (but have proven they can grow earnings).
New: Manage All Your Stock Portfolios in One Place
We've created the ultimate portfolio companion for stock investors, and it's free.
• Connect an unlimited number of Portfolios and see your total in one currency
• Be alerted to new Warning Signs or Risks via email or mobile
• Track the Fair Value of your stocks
Have feedback on this article? Concerned about the content? Get in touch with us directly. Alternatively, email editorial-team (at) simplywallst.com.
This article by Simply Wall St is general in nature. We provide commentary based on historical data and analyst forecasts only using an unbiased methodology and our articles are not intended to be financial advice. It does not constitute a recommendation to buy or sell any stock, and does not take account of your objectives, or your financial situation. We aim to bring you long-term focused analysis driven by fundamental data. Note that our analysis may not factor in the latest price-sensitive company announcements or qualitative material. Simply Wall St has no position in any stocks mentioned.
Have feedback on this article? Concerned about the content? Get in touch with us directly. Alternatively, email editorial-team@simplywallst.com
About SHSE:600692
Shang Hai Ya TongLtd
Engages in the real estate development business in China.
Flawless balance sheet low.
Market Insights

Community Narratives


