- China
- /
- Real Estate
- /
- SHSE:600225
Lacklustre Performance Is Driving Tianjin Troila Information Technology Co.,Ltd.'s (SHSE:600225) 28% Price Drop


Tianjin Troila Information Technology Co.,Ltd. (SHSE:600225) shareholders that were waiting for something to happen have been dealt a blow with a 28% share price drop in the last month. The drop over the last 30 days has capped off a tough year for shareholders, with the share price down 47% in that time.
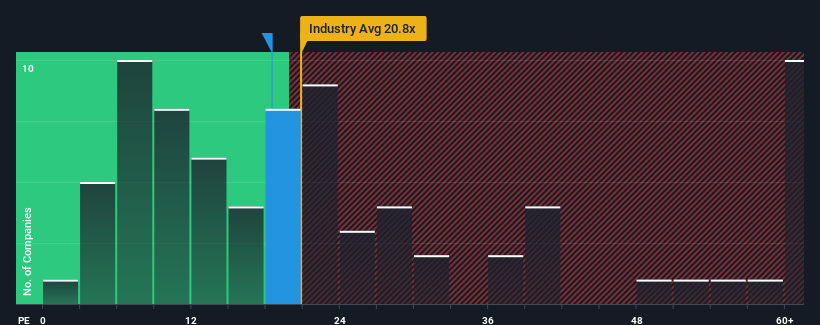
Although its price has dipped substantially, Tianjin Troila Information TechnologyLtd may still be sending bullish signals at the moment with its price-to-earnings (or "P/E") ratio of 18.5x, since almost half of all companies in China have P/E ratios greater than 30x and even P/E's higher than 54x are not unusual. Nonetheless, we'd need to dig a little deeper to determine if there is a rational basis for the reduced P/E.
For instance, Tianjin Troila Information TechnologyLtd's receding earnings in recent times would have to be some food for thought. It might be that many expect the disappointing earnings performance to continue or accelerate, which has repressed the P/E. However, if this doesn't eventuate then existing shareholders may be feeling optimistic about the future direction of the share price.
Check out our latest analysis for Tianjin Troila Information TechnologyLtd
What Are Growth Metrics Telling Us About The Low P/E?
In order to justify its P/E ratio, Tianjin Troila Information TechnologyLtd would need to produce sluggish growth that's trailing the market.
Retrospectively, the last year delivered a frustrating 59% decrease to the company's bottom line. Unfortunately, that's brought it right back to where it started three years ago with EPS growth being virtually non-existent overall during that time. So it appears to us that the company has had a mixed result in terms of growing earnings over that time.
This is in contrast to the rest of the market, which is expected to grow by 36% over the next year, materially higher than the company's recent medium-term annualised growth rates.
With this information, we can see why Tianjin Troila Information TechnologyLtd is trading at a P/E lower than the market. It seems most investors are expecting to see the recent limited growth rates continue into the future and are only willing to pay a reduced amount for the stock.
The Key Takeaway
The softening of Tianjin Troila Information TechnologyLtd's shares means its P/E is now sitting at a pretty low level. Generally, our preference is to limit the use of the price-to-earnings ratio to establishing what the market thinks about the overall health of a company.
As we suspected, our examination of Tianjin Troila Information TechnologyLtd revealed its three-year earnings trends are contributing to its low P/E, given they look worse than current market expectations. Right now shareholders are accepting the low P/E as they concede future earnings probably won't provide any pleasant surprises. Unless the recent medium-term conditions improve, they will continue to form a barrier for the share price around these levels.
Before you settle on your opinion, we've discovered 3 warning signs for Tianjin Troila Information TechnologyLtd that you should be aware of.
It's important to make sure you look for a great company, not just the first idea you come across. So take a peek at this free list of interesting companies with strong recent earnings growth (and a low P/E).
Valuation is complex, but we're here to simplify it.
Discover if Tianjin Troila Information TechnologyLtd might be undervalued or overvalued with our detailed analysis, featuring fair value estimates, potential risks, dividends, insider trades, and its financial condition.
Access Free AnalysisHave feedback on this article? Concerned about the content? Get in touch with us directly. Alternatively, email editorial-team (at) simplywallst.com.
This article by Simply Wall St is general in nature. We provide commentary based on historical data and analyst forecasts only using an unbiased methodology and our articles are not intended to be financial advice. It does not constitute a recommendation to buy or sell any stock, and does not take account of your objectives, or your financial situation. We aim to bring you long-term focused analysis driven by fundamental data. Note that our analysis may not factor in the latest price-sensitive company announcements or qualitative material. Simply Wall St has no position in any stocks mentioned.
About SHSE:600225
Tianjin Troila Information TechnologyLtd
Tianjin Troila Information Technology Co.,Ltd.
Slightly overvalued with imperfect balance sheet.
Market Insights

Community Narratives


