
Advertisement
Has Acrobiosystems Co.,Ltd.'s (SZSE:301080) Impressive Stock Performance Got Anything to Do With Its Fundamentals?

Most readers would already be aware that AcrobiosystemsLtd's (SZSE:301080) stock increased significantly by 18% over the past week. Given that stock prices are usually aligned with a company's financial performance in the long-term, we decided to study its financial indicators more closely to see if they had a hand to play in the recent price move. In this article, we decided to focus on AcrobiosystemsLtd's ROE.
Return on equity or ROE is an important factor to be considered by a shareholder because it tells them how effectively their capital is being reinvested. Simply put, it is used to assess the profitability of a company in relation to its equity capital.
View our latest analysis for AcrobiosystemsLtd
How To Calculate Return On Equity?
The formula for ROE is:
Return on Equity = Net Profit (from continuing operations) ÷ Shareholders' Equity
So, based on the above formula, the ROE for AcrobiosystemsLtd is:
4.5% = CN¥115m ÷ CN¥2.5b (Based on the trailing twelve months to June 2024).
The 'return' is the income the business earned over the last year. Another way to think of that is that for every CN¥1 worth of equity, the company was able to earn CN¥0.05 in profit.
What Has ROE Got To Do With Earnings Growth?
We have already established that ROE serves as an efficient profit-generating gauge for a company's future earnings. We now need to evaluate how much profit the company reinvests or "retains" for future growth which then gives us an idea about the growth potential of the company. Generally speaking, other things being equal, firms with a high return on equity and profit retention, have a higher growth rate than firms that don’t share these attributes.
A Side By Side comparison of AcrobiosystemsLtd's Earnings Growth And 4.5% ROE
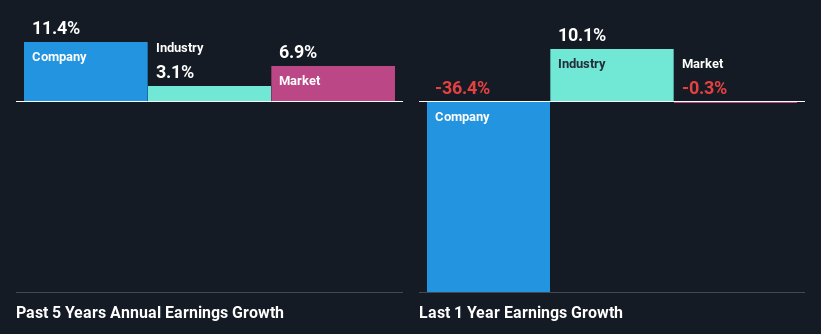
As you can see, AcrobiosystemsLtd's ROE looks pretty weak. Even compared to the average industry ROE of 5.8%, the company's ROE is quite dismal. Although, we can see that AcrobiosystemsLtd saw a modest net income growth of 11% over the past five years. Therefore, the growth in earnings could probably have been caused by other variables. Such as - high earnings retention or an efficient management in place.
We then compared AcrobiosystemsLtd's net income growth with the industry and we're pleased to see that the company's growth figure is higher when compared with the industry which has a growth rate of 3.1% in the same 5-year period.
Earnings growth is an important metric to consider when valuing a stock. What investors need to determine next is if the expected earnings growth, or the lack of it, is already built into the share price. This then helps them determine if the stock is placed for a bright or bleak future. What is 301080 worth today? The intrinsic value infographic in our free research report helps visualize whether 301080 is currently mispriced by the market.
Is AcrobiosystemsLtd Using Its Retained Earnings Effectively?
While AcrobiosystemsLtd has a three-year median payout ratio of 61% (which means it retains 39% of profits), the company has still seen a fair bit of earnings growth in the past, meaning that its high payout ratio hasn't hampered its ability to grow.
While AcrobiosystemsLtd has seen growth in its earnings, it only recently started to pay a dividend. It is most likely that the company decided to impress new and existing shareholders with a dividend.
Summary
Overall, we feel that AcrobiosystemsLtd certainly does have some positive factors to consider. Namely, its high earnings growth. We do however feel that the earnings growth number could have been even higher, had the company been reinvesting more of its earnings and paid out less dividends. That being so, the latest analyst forecasts show that the company will continue to see an expansion in its earnings. To know more about the latest analysts predictions for the company, check out this visualization of analyst forecasts for the company.
New: Manage All Your Stock Portfolios in One Place
We've created the ultimate portfolio companion for stock investors, and it's free.
• Connect an unlimited number of Portfolios and see your total in one currency
• Be alerted to new Warning Signs or Risks via email or mobile
• Track the Fair Value of your stocks
Have feedback on this article? Concerned about the content? Get in touch with us directly. Alternatively, email editorial-team (at) simplywallst.com.
This article by Simply Wall St is general in nature. We provide commentary based on historical data and analyst forecasts only using an unbiased methodology and our articles are not intended to be financial advice. It does not constitute a recommendation to buy or sell any stock, and does not take account of your objectives, or your financial situation. We aim to bring you long-term focused analysis driven by fundamental data. Note that our analysis may not factor in the latest price-sensitive company announcements or qualitative material. Simply Wall St has no position in any stocks mentioned.
About SZSE:301080
AcrobiosystemsLtd
Engages in the development and manufacture of recombinant proteins, antibodies, and other biological reagents for pharmaceutical and biotechnology companies, and scientific research institutions.
Excellent balance sheet with reasonable growth potential.
Market Insights


Advertisement
Community Narratives
The Future of Drug Testing? Fingerprint Tech Shows Serious Promise
Fair Value US$2.98|40.3% undervalued
JO
Community Contributor
Suncorp’s Next Chapter: Insurance-Only and Ready to Grow
Fair Value AU$22.83|7.6% undervalued
RO
Community Contributor
Thyssenkrupp Nucera Will Achieve Double-Digit Profits by 2030 Boosted by Hydrogen Growth
Fair Value €14.40|30.6% undervalued
CH
Community Contributor
Tesla’s Nvidia Moment – The AI & Robotics Inflection Point
Fair Value US$359.72|12.3% undervalued
BL
Community Contributor