
Advertisement
ShanXi C&Y Pharmaceutical Group Co., Ltd.'s (SZSE:300254) Price Is Right But Growth Is Lacking After Shares Rocket 28%

ShanXi C&Y Pharmaceutical Group Co., Ltd. (SZSE:300254) shareholders are no doubt pleased to see that the share price has bounced 28% in the last month, although it is still struggling to make up recently lost ground. Taking a wider view, although not as strong as the last month, the full year gain of 15% is also fairly reasonable.
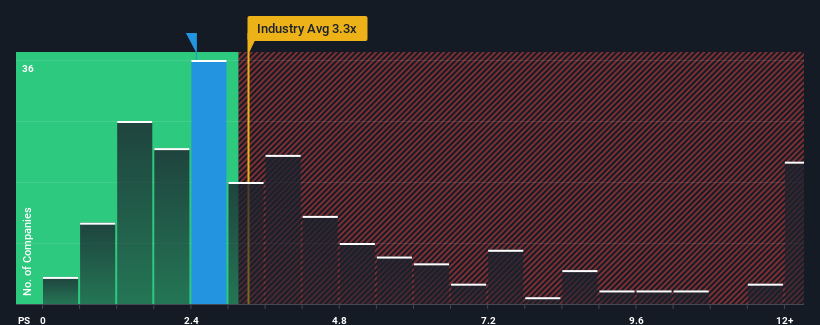
Although its price has surged higher, ShanXi C&Y Pharmaceutical Group may still be sending bullish signals at the moment with its price-to-sales (or "P/S") ratio of 2.5x, since almost half of all companies in the Pharmaceuticals industry in China have P/S ratios greater than 3.3x and even P/S higher than 6x are not unusual. However, the P/S might be low for a reason and it requires further investigation to determine if it's justified.
See our latest analysis for ShanXi C&Y Pharmaceutical Group
What Does ShanXi C&Y Pharmaceutical Group's Recent Performance Look Like?
For instance, ShanXi C&Y Pharmaceutical Group's receding revenue in recent times would have to be some food for thought. One possibility is that the P/S is low because investors think the company won't do enough to avoid underperforming the broader industry in the near future. However, if this doesn't eventuate then existing shareholders may be feeling optimistic about the future direction of the share price.
We don't have analyst forecasts, but you can see how recent trends are setting up the company for the future by checking out our free report on ShanXi C&Y Pharmaceutical Group's earnings, revenue and cash flow.What Are Revenue Growth Metrics Telling Us About The Low P/S?
The only time you'd be truly comfortable seeing a P/S as low as ShanXi C&Y Pharmaceutical Group's is when the company's growth is on track to lag the industry.
Taking a look back first, the company's revenue growth last year wasn't something to get excited about as it posted a disappointing decline of 9.4%. This means it has also seen a slide in revenue over the longer-term as revenue is down 11% in total over the last three years. Therefore, it's fair to say the revenue growth recently has been undesirable for the company.
Comparing that to the industry, which is predicted to deliver 17% growth in the next 12 months, the company's downward momentum based on recent medium-term revenue results is a sobering picture.
With this in mind, we understand why ShanXi C&Y Pharmaceutical Group's P/S is lower than most of its industry peers. Nonetheless, there's no guarantee the P/S has reached a floor yet with revenue going in reverse. Even just maintaining these prices could be difficult to achieve as recent revenue trends are already weighing down the shares.
The Bottom Line On ShanXi C&Y Pharmaceutical Group's P/S
Despite ShanXi C&Y Pharmaceutical Group's share price climbing recently, its P/S still lags most other companies. Using the price-to-sales ratio alone to determine if you should sell your stock isn't sensible, however it can be a practical guide to the company's future prospects.
It's no surprise that ShanXi C&Y Pharmaceutical Group maintains its low P/S off the back of its sliding revenue over the medium-term. Right now shareholders are accepting the low P/S as they concede future revenue probably won't provide any pleasant surprises either. If recent medium-term revenue trends continue, it's hard to see the share price moving strongly in either direction in the near future under these circumstances.
It's always necessary to consider the ever-present spectre of investment risk. We've identified 2 warning signs with ShanXi C&Y Pharmaceutical Group (at least 1 which shouldn't be ignored), and understanding these should be part of your investment process.
If companies with solid past earnings growth is up your alley, you may wish to see this free collection of other companies with strong earnings growth and low P/E ratios.
New: Manage All Your Stock Portfolios in One Place
We've created the ultimate portfolio companion for stock investors, and it's free.
• Connect an unlimited number of Portfolios and see your total in one currency
• Be alerted to new Warning Signs or Risks via email or mobile
• Track the Fair Value of your stocks
Have feedback on this article? Concerned about the content? Get in touch with us directly. Alternatively, email editorial-team (at) simplywallst.com.
This article by Simply Wall St is general in nature. We provide commentary based on historical data and analyst forecasts only using an unbiased methodology and our articles are not intended to be financial advice. It does not constitute a recommendation to buy or sell any stock, and does not take account of your objectives, or your financial situation. We aim to bring you long-term focused analysis driven by fundamental data. Note that our analysis may not factor in the latest price-sensitive company announcements or qualitative material. Simply Wall St has no position in any stocks mentioned.
About SZSE:300254
ShanXi C&Y Pharmaceutical GroupLTD
Engages in the research, development, production, and sale of medicine and health food products.
Questionable track record with worrying balance sheet.
Market Insights

Advertisement
Community Narratives

BMW cruising ahead with new EVs and premium models to boost revenue 5%
Fair Value €135.07|44.6% undervalued
UN
Community Contributor
EU#2 - From Humble Beginnings to Global Powerhouse
Fair Value DKK 851.04|46.4% undervalued
TO
Community Contributor