
Advertisement
Estimating The Fair Value Of Zhejiang Xianju Pharmaceutical Co.,Ltd. (SZSE:002332)

Key Insights
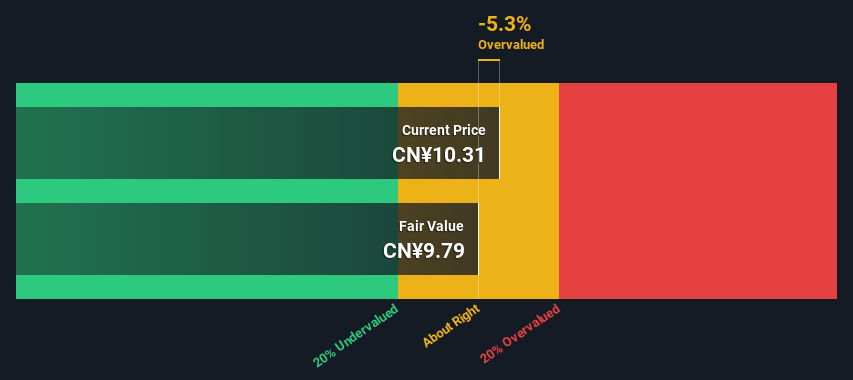
- The projected fair value for Zhejiang Xianju PharmaceuticalLtd is CN¥9.79 based on 2 Stage Free Cash Flow to Equity
- With CN¥10.31 share price, Zhejiang Xianju PharmaceuticalLtd appears to be trading close to its estimated fair value
- The CN¥16.60 analyst price target for 2332 is 70% more than our estimate of fair value
Today we will run through one way of estimating the intrinsic value of Zhejiang Xianju Pharmaceutical Co.,Ltd. (SZSE:002332) by projecting its future cash flows and then discounting them to today's value. We will use the Discounted Cash Flow (DCF) model on this occasion. Believe it or not, it's not too difficult to follow, as you'll see from our example!
We generally believe that a company's value is the present value of all of the cash it will generate in the future. However, a DCF is just one valuation metric among many, and it is not without flaws. For those who are keen learners of equity analysis, the Simply Wall St analysis model here may be something of interest to you.
See our latest analysis for Zhejiang Xianju PharmaceuticalLtd
Is Zhejiang Xianju PharmaceuticalLtd Fairly Valued?
We are going to use a two-stage DCF model, which, as the name states, takes into account two stages of growth. The first stage is generally a higher growth period which levels off heading towards the terminal value, captured in the second 'steady growth' period. To start off with, we need to estimate the next ten years of cash flows. Seeing as no analyst estimates of free cash flow are available to us, we have extrapolate the previous free cash flow (FCF) from the company's last reported value. We assume companies with shrinking free cash flow will slow their rate of shrinkage, and that companies with growing free cash flow will see their growth rate slow, over this period. We do this to reflect that growth tends to slow more in the early years than it does in later years.
Generally we assume that a dollar today is more valuable than a dollar in the future, and so the sum of these future cash flows is then discounted to today's value:
10-year free cash flow (FCF) forecast
| 2024 | 2025 | 2026 | 2027 | 2028 | 2029 | 2030 | 2031 | 2032 | 2033 | |
| Levered FCF (CN¥, Millions) | CN¥497.2m | CN¥488.4m | CN¥486.7m | CN¥489.7m | CN¥496.2m | CN¥505.2m | CN¥516.0m | CN¥528.3m | CN¥541.8m | CN¥556.3m |
| Growth Rate Estimate Source | Est @ -3.79% | Est @ -1.77% | Est @ -0.36% | Est @ 0.63% | Est @ 1.32% | Est @ 1.81% | Est @ 2.15% | Est @ 2.39% | Est @ 2.55% | Est @ 2.67% |
| Present Value (CN¥, Millions) Discounted @ 7.4% | CN¥463 | CN¥423 | CN¥392 | CN¥367 | CN¥347 | CN¥328 | CN¥312 | CN¥297 | CN¥284 | CN¥271 |
("Est" = FCF growth rate estimated by Simply Wall St)
Present Value of 10-year Cash Flow (PVCF) = CN¥3.5b
The second stage is also known as Terminal Value, this is the business's cash flow after the first stage. For a number of reasons a very conservative growth rate is used that cannot exceed that of a country's GDP growth. In this case we have used the 5-year average of the 10-year government bond yield (2.9%) to estimate future growth. In the same way as with the 10-year 'growth' period, we discount future cash flows to today's value, using a cost of equity of 7.4%.
Terminal Value (TV)= FCF2033 × (1 + g) ÷ (r – g) = CN¥556m× (1 + 2.9%) ÷ (7.4%– 2.9%) = CN¥13b
Present Value of Terminal Value (PVTV)= TV / (1 + r)10= CN¥13b÷ ( 1 + 7.4%)10= CN¥6.2b
The total value, or equity value, is then the sum of the present value of the future cash flows, which in this case is CN¥9.7b. The last step is to then divide the equity value by the number of shares outstanding. Compared to the current share price of CN¥10.3, the company appears around fair value at the time of writing. The assumptions in any calculation have a big impact on the valuation, so it is better to view this as a rough estimate, not precise down to the last cent.
The Assumptions
We would point out that the most important inputs to a discounted cash flow are the discount rate and of course the actual cash flows. If you don't agree with these result, have a go at the calculation yourself and play with the assumptions. The DCF also does not consider the possible cyclicality of an industry, or a company's future capital requirements, so it does not give a full picture of a company's potential performance. Given that we are looking at Zhejiang Xianju PharmaceuticalLtd as potential shareholders, the cost of equity is used as the discount rate, rather than the cost of capital (or weighted average cost of capital, WACC) which accounts for debt. In this calculation we've used 7.4%, which is based on a levered beta of 0.800. Beta is a measure of a stock's volatility, compared to the market as a whole. We get our beta from the industry average beta of globally comparable companies, with an imposed limit between 0.8 and 2.0, which is a reasonable range for a stable business.
SWOT Analysis for Zhejiang Xianju PharmaceuticalLtd
Strength
- Debt is not viewed as a risk.
- Dividends are covered by earnings and cash flows.
- Dividend is in the top 25% of dividend payers in the market.
Weakness
- Earnings growth over the past year underperformed the Pharmaceuticals industry.
Opportunity
- Annual earnings are forecast to grow for the next 3 years.
- Good value based on P/E ratio compared to estimated Fair P/E ratio.
Threat
- Annual earnings are forecast to grow slower than the Chinese market.
Next Steps:
Although the valuation of a company is important, it shouldn't be the only metric you look at when researching a company. DCF models are not the be-all and end-all of investment valuation. Preferably you'd apply different cases and assumptions and see how they would impact the company's valuation. If a company grows at a different rate, or if its cost of equity or risk free rate changes sharply, the output can look very different. For Zhejiang Xianju PharmaceuticalLtd, we've compiled three fundamental factors you should assess:
- Risks: Every company has them, and we've spotted 1 warning sign for Zhejiang Xianju PharmaceuticalLtd you should know about.
- Future Earnings: How does 002332's growth rate compare to its peers and the wider market? Dig deeper into the analyst consensus number for the upcoming years by interacting with our free analyst growth expectation chart.
- Other High Quality Alternatives: Do you like a good all-rounder? Explore our interactive list of high quality stocks to get an idea of what else is out there you may be missing!
PS. Simply Wall St updates its DCF calculation for every Chinese stock every day, so if you want to find the intrinsic value of any other stock just search here.
Valuation is complex, but we're here to simplify it.
Discover if Zhejiang Xianju PharmaceuticalLtd might be undervalued or overvalued with our detailed analysis, featuring fair value estimates, potential risks, dividends, insider trades, and its financial condition.
Access Free AnalysisHave feedback on this article? Concerned about the content? Get in touch with us directly. Alternatively, email editorial-team (at) simplywallst.com.
This article by Simply Wall St is general in nature. We provide commentary based on historical data and analyst forecasts only using an unbiased methodology and our articles are not intended to be financial advice. It does not constitute a recommendation to buy or sell any stock, and does not take account of your objectives, or your financial situation. We aim to bring you long-term focused analysis driven by fundamental data. Note that our analysis may not factor in the latest price-sensitive company announcements or qualitative material. Simply Wall St has no position in any stocks mentioned.
About SZSE:002332
Zhejiang Xianju PharmaceuticalLtd
Manufactures and sells steroids and hormones worldwide.
Flawless balance sheet established dividend payer.
Market Insights

Advertisement
Community Narratives

BMW cruising ahead with new EVs and premium models to boost revenue 5%
Fair Value €135.07|44.6% undervalued
UN
Community Contributor
EU#2 - From Humble Beginnings to Global Powerhouse
Fair Value DKK 851.04|48.2% undervalued
TO
Community Contributor