
Advertisement
What Shanghai Fudan Forward S&T Co., Ltd's (SHSE:600624) 33% Share Price Gain Is Not Telling You

Shanghai Fudan Forward S&T Co., Ltd (SHSE:600624) shareholders have had their patience rewarded with a 33% share price jump in the last month. Unfortunately, the gains of the last month did little to right the losses of the last year with the stock still down 35% over that time.
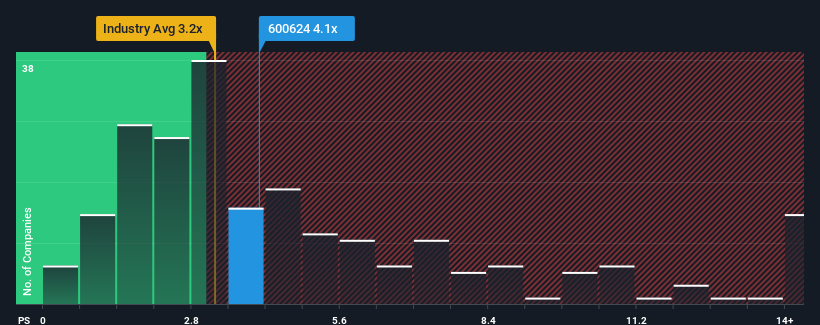
Since its price has surged higher, you could be forgiven for thinking Shanghai Fudan Forward S&T is a stock not worth researching with a price-to-sales ratios (or "P/S") of 4.1x, considering almost half the companies in China's Pharmaceuticals industry have P/S ratios below 3.2x. Although, it's not wise to just take the P/S at face value as there may be an explanation why it's as high as it is.
View our latest analysis for Shanghai Fudan Forward S&T
What Does Shanghai Fudan Forward S&T's Recent Performance Look Like?
As an illustration, revenue has deteriorated at Shanghai Fudan Forward S&T over the last year, which is not ideal at all. Perhaps the market believes the company can do enough to outperform the rest of the industry in the near future, which is keeping the P/S ratio high. If not, then existing shareholders may be quite nervous about the viability of the share price.
We don't have analyst forecasts, but you can see how recent trends are setting up the company for the future by checking out our free report on Shanghai Fudan Forward S&T's earnings, revenue and cash flow.Is There Enough Revenue Growth Forecasted For Shanghai Fudan Forward S&T?
There's an inherent assumption that a company should outperform the industry for P/S ratios like Shanghai Fudan Forward S&T's to be considered reasonable.
In reviewing the last year of financials, we were disheartened to see the company's revenues fell to the tune of 15%. This means it has also seen a slide in revenue over the longer-term as revenue is down 35% in total over the last three years. Accordingly, shareholders would have felt downbeat about the medium-term rates of revenue growth.
In contrast to the company, the rest of the industry is expected to grow by 134% over the next year, which really puts the company's recent medium-term revenue decline into perspective.
With this information, we find it concerning that Shanghai Fudan Forward S&T is trading at a P/S higher than the industry. It seems most investors are ignoring the recent poor growth rate and are hoping for a turnaround in the company's business prospects. Only the boldest would assume these prices are sustainable as a continuation of recent revenue trends is likely to weigh heavily on the share price eventually.
What We Can Learn From Shanghai Fudan Forward S&T's P/S?
Shanghai Fudan Forward S&T shares have taken a big step in a northerly direction, but its P/S is elevated as a result. Generally, our preference is to limit the use of the price-to-sales ratio to establishing what the market thinks about the overall health of a company.
Our examination of Shanghai Fudan Forward S&T revealed its shrinking revenue over the medium-term isn't resulting in a P/S as low as we expected, given the industry is set to grow. When we see revenue heading backwards and underperforming the industry forecasts, we feel the possibility of the share price declining is very real, bringing the P/S back into the realm of reasonability. If recent medium-term revenue trends continue, it will place shareholders' investments at significant risk and potential investors in danger of paying an excessive premium.
It's always necessary to consider the ever-present spectre of investment risk. We've identified 2 warning signs with Shanghai Fudan Forward S&T, and understanding them should be part of your investment process.
If strong companies turning a profit tickle your fancy, then you'll want to check out this free list of interesting companies that trade on a low P/E (but have proven they can grow earnings).
New: Manage All Your Stock Portfolios in One Place
We've created the ultimate portfolio companion for stock investors, and it's free.
• Connect an unlimited number of Portfolios and see your total in one currency
• Be alerted to new Warning Signs or Risks via email or mobile
• Track the Fair Value of your stocks
Have feedback on this article? Concerned about the content? Get in touch with us directly. Alternatively, email editorial-team (at) simplywallst.com.
This article by Simply Wall St is general in nature. We provide commentary based on historical data and analyst forecasts only using an unbiased methodology and our articles are not intended to be financial advice. It does not constitute a recommendation to buy or sell any stock, and does not take account of your objectives, or your financial situation. We aim to bring you long-term focused analysis driven by fundamental data. Note that our analysis may not factor in the latest price-sensitive company announcements or qualitative material. Simply Wall St has no position in any stocks mentioned.
About SHSE:600624
Shanghai Fudan Forward S&T
Operates in software development, biomedicine, real estate, and other businesses.
Excellent balance sheet and overvalued.
Market Insights

Advertisement
Community Narratives
MicroStrategy: Volatile Gamble or Golden Opportunity?
Fair Value US$663.00|36.2% undervalued
BL
Community Contributor
Emerging Markets and Debt Reduction Will Propel Bath & Body Works Forward
Fair Value US$40.73|22.0% undervalued
ZW
Community Contributor
An amazing opportunity to potentially get a 100 bagger
Fair Value US$10.00|46.4% overvalued
DA
Community Contributor