
Advertisement
What Shanghai Fudan Forward S&T Co., Ltd's (SHSE:600624) 32% Share Price Gain Is Not Telling You

Shanghai Fudan Forward S&T Co., Ltd (SHSE:600624) shareholders would be excited to see that the share price has had a great month, posting a 32% gain and recovering from prior weakness. Not all shareholders will be feeling jubilant, since the share price is still down a very disappointing 34% in the last twelve months.
Following the firm bounce in price, given close to half the companies operating in China's Pharmaceuticals industry have price-to-sales ratios (or "P/S") below 2.9x, you may consider Shanghai Fudan Forward S&T as a stock to potentially avoid with its 4x P/S ratio. Although, it's not wise to just take the P/S at face value as there may be an explanation why it's as high as it is.
Check out our latest analysis for Shanghai Fudan Forward S&T
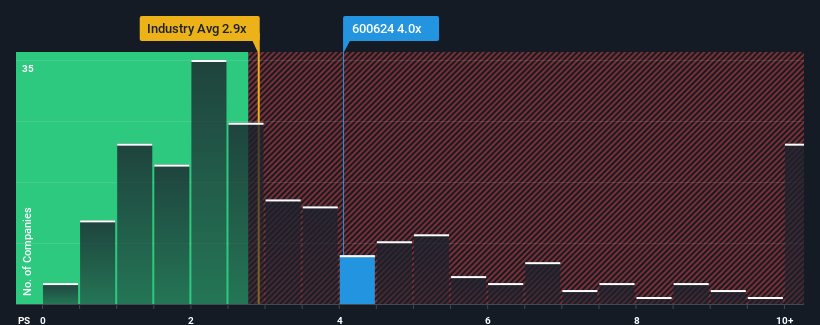
What Does Shanghai Fudan Forward S&T's Recent Performance Look Like?
For instance, Shanghai Fudan Forward S&T's receding revenue in recent times would have to be some food for thought. It might be that many expect the company to still outplay most other companies over the coming period, which has kept the P/S from collapsing. If not, then existing shareholders may be quite nervous about the viability of the share price.
We don't have analyst forecasts, but you can see how recent trends are setting up the company for the future by checking out our free report on Shanghai Fudan Forward S&T's earnings, revenue and cash flow.What Are Revenue Growth Metrics Telling Us About The High P/S?
The only time you'd be truly comfortable seeing a P/S as high as Shanghai Fudan Forward S&T's is when the company's growth is on track to outshine the industry.
Taking a look back first, the company's revenue growth last year wasn't something to get excited about as it posted a disappointing decline of 10%. This means it has also seen a slide in revenue over the longer-term as revenue is down 32% in total over the last three years. Accordingly, shareholders would have felt downbeat about the medium-term rates of revenue growth.
Comparing that to the industry, which is predicted to deliver 17% growth in the next 12 months, the company's downward momentum based on recent medium-term revenue results is a sobering picture.
In light of this, it's alarming that Shanghai Fudan Forward S&T's P/S sits above the majority of other companies. Apparently many investors in the company are way more bullish than recent times would indicate and aren't willing to let go of their stock at any price. There's a very good chance existing shareholders are setting themselves up for future disappointment if the P/S falls to levels more in line with the recent negative growth rates.
The Final Word
Shanghai Fudan Forward S&T's P/S is on the rise since its shares have risen strongly. We'd say the price-to-sales ratio's power isn't primarily as a valuation instrument but rather to gauge current investor sentiment and future expectations.
We've established that Shanghai Fudan Forward S&T currently trades on a much higher than expected P/S since its recent revenues have been in decline over the medium-term. Right now we aren't comfortable with the high P/S as this revenue performance is highly unlikely to support such positive sentiment for long. If recent medium-term revenue trends continue, it will place shareholders' investments at significant risk and potential investors in danger of paying an excessive premium.
There are also other vital risk factors to consider and we've discovered 2 warning signs for Shanghai Fudan Forward S&T (1 can't be ignored!) that you should be aware of before investing here.
Of course, profitable companies with a history of great earnings growth are generally safer bets. So you may wish to see this free collection of other companies that have reasonable P/E ratios and have grown earnings strongly.
New: Manage All Your Stock Portfolios in One Place
We've created the ultimate portfolio companion for stock investors, and it's free.
• Connect an unlimited number of Portfolios and see your total in one currency
• Be alerted to new Warning Signs or Risks via email or mobile
• Track the Fair Value of your stocks
Have feedback on this article? Concerned about the content? Get in touch with us directly. Alternatively, email editorial-team (at) simplywallst.com.
This article by Simply Wall St is general in nature. We provide commentary based on historical data and analyst forecasts only using an unbiased methodology and our articles are not intended to be financial advice. It does not constitute a recommendation to buy or sell any stock, and does not take account of your objectives, or your financial situation. We aim to bring you long-term focused analysis driven by fundamental data. Note that our analysis may not factor in the latest price-sensitive company announcements or qualitative material. Simply Wall St has no position in any stocks mentioned.
Have feedback on this article? Concerned about the content? Get in touch with us directly. Alternatively, email editorial-team@simplywallst.com
About SHSE:600624
Shanghai Fudan Forward S&T
Operates in software development, biomedicine, real estate, and other businesses.
Excellent balance sheet and overvalued.
Market Insights

Advertisement
Community Narratives
MicroStrategy: Volatile Gamble or Golden Opportunity?
Fair Value US$663.00|36.2% undervalued
BL
Community Contributor
Emerging Markets and Debt Reduction Will Propel Bath & Body Works Forward
Fair Value US$40.73|22.0% undervalued
ZW
Community Contributor
An amazing opportunity to potentially get a 100 bagger
Fair Value US$10.00|46.4% overvalued
DA
Community Contributor