Take Care Before Jumping Onto Zhejiang Meorient Commerce Exhibition Inc. (SZSE:300795) Even Though It's 27% Cheaper

To the annoyance of some shareholders, Zhejiang Meorient Commerce Exhibition Inc. (SZSE:300795) shares are down a considerable 27% in the last month, which continues a horrid run for the company. Instead of being rewarded, shareholders who have already held through the last twelve months are now sitting on a 41% share price drop.
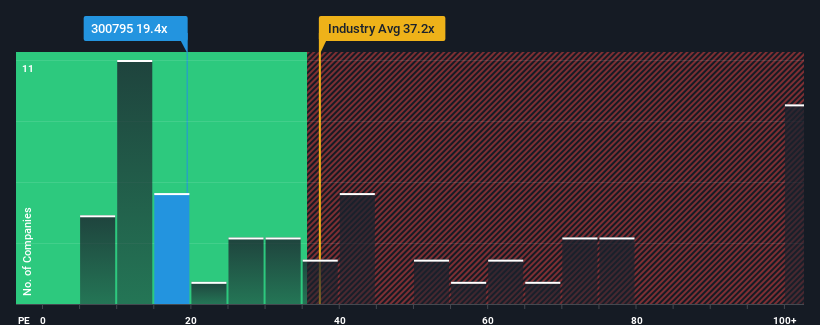
In spite of the heavy fall in price, Zhejiang Meorient Commerce Exhibition may still be sending bullish signals at the moment with its price-to-earnings (or "P/E") ratio of 19.4x, since almost half of all companies in China have P/E ratios greater than 28x and even P/E's higher than 52x are not unusual. Although, it's not wise to just take the P/E at face value as there may be an explanation why it's limited.
Zhejiang Meorient Commerce Exhibition certainly has been doing a good job lately as it's been growing earnings more than most other companies. One possibility is that the P/E is low because investors think this strong earnings performance might be less impressive moving forward. If you like the company, you'd be hoping this isn't the case so that you could potentially pick up some stock while it's out of favour.
See our latest analysis for Zhejiang Meorient Commerce Exhibition

How Is Zhejiang Meorient Commerce Exhibition's Growth Trending?
There's an inherent assumption that a company should underperform the market for P/E ratios like Zhejiang Meorient Commerce Exhibition's to be considered reasonable.
Taking a look back first, we see that the company grew earnings per share by an impressive 167% last year. However, the latest three year period hasn't been as great in aggregate as it didn't manage to provide any growth at all. Therefore, it's fair to say that earnings growth has been inconsistent recently for the company.
Looking ahead now, EPS is anticipated to climb by 29% each year during the coming three years according to the four analysts following the company. With the market only predicted to deliver 24% per year, the company is positioned for a stronger earnings result.
In light of this, it's peculiar that Zhejiang Meorient Commerce Exhibition's P/E sits below the majority of other companies. It looks like most investors are not convinced at all that the company can achieve future growth expectations.
The Bottom Line On Zhejiang Meorient Commerce Exhibition's P/E
The softening of Zhejiang Meorient Commerce Exhibition's shares means its P/E is now sitting at a pretty low level. Generally, our preference is to limit the use of the price-to-earnings ratio to establishing what the market thinks about the overall health of a company.
Our examination of Zhejiang Meorient Commerce Exhibition's analyst forecasts revealed that its superior earnings outlook isn't contributing to its P/E anywhere near as much as we would have predicted. When we see a strong earnings outlook with faster-than-market growth, we assume potential risks are what might be placing significant pressure on the P/E ratio. It appears many are indeed anticipating earnings instability, because these conditions should normally provide a boost to the share price.
You should always think about risks. Case in point, we've spotted 1 warning sign for Zhejiang Meorient Commerce Exhibition you should be aware of.
If P/E ratios interest you, you may wish to see this free collection of other companies with strong earnings growth and low P/E ratios.
If you're looking to trade Zhejiang Meorient Commerce Exhibition, open an account with the lowest-cost platform trusted by professionals, Interactive Brokers.
With clients in over 200 countries and territories, and access to 160 markets, IBKR lets you trade stocks, options, futures, forex, bonds and funds from a single integrated account.
Enjoy no hidden fees, no account minimums, and FX conversion rates as low as 0.03%, far better than what most brokers offer.
Sponsored ContentValuation is complex, but we're here to simplify it.
Discover if Zhejiang Meorient Commerce Exhibition might be undervalued or overvalued with our detailed analysis, featuring fair value estimates, potential risks, dividends, insider trades, and its financial condition.
Access Free AnalysisHave feedback on this article? Concerned about the content? Get in touch with us directly. Alternatively, email editorial-team (at) simplywallst.com.
This article by Simply Wall St is general in nature. We provide commentary based on historical data and analyst forecasts only using an unbiased methodology and our articles are not intended to be financial advice. It does not constitute a recommendation to buy or sell any stock, and does not take account of your objectives, or your financial situation. We aim to bring you long-term focused analysis driven by fundamental data. Note that our analysis may not factor in the latest price-sensitive company announcements or qualitative material. Simply Wall St has no position in any stocks mentioned.
Have feedback on this article? Concerned about the content? Get in touch with us directly. Alternatively, email editorial-team@simplywallst.com
About SZSE:300795
Zhejiang Meorient Commerce Exhibition
Zhejiang Meorient Commerce Exhibition Inc.
Exceptional growth potential with excellent balance sheet and pays a dividend.
Market Insights
Community Narratives


