Advertisement
Aurora OptoelectronicsLtd And 2 Other Asian Penny Stocks To Watch

Simply Wall St
Reviewed by Simply Wall St

As trade tensions between the U.S. and China show signs of easing, Asian markets are experiencing a period of cautious optimism, with investors looking for opportunities in less conventional spaces. Penny stocks, often representing smaller or newer companies, remain an intriguing area for those willing to explore beyond the mainstream market players. Despite being an outdated term, penny stocks can still offer valuable prospects when backed by strong financial health and growth potential.
Top 10 Penny Stocks In Asia
| Name | Share Price | Market Cap | Rewards & Risks |
| Advice IT Infinite (SET:ADVICE) | THB4.82 | THB2.99B | ✅ 4 ⚠️ 3 View Analysis > |
| T.A.C. Consumer (SET:TACC) | THB4.60 | THB2.76B | ✅ 3 ⚠️ 2 View Analysis > |
| Chumporn Palm Oil Industry (SET:CPI) | THB2.56 | THB1.62B | ✅ 2 ⚠️ 2 View Analysis > |
| CNMC Goldmine Holdings (Catalist:5TP) | SGD0.42 | SGD170.22M | ✅ 4 ⚠️ 3 View Analysis > |
| Beng Kuang Marine (SGX:BEZ) | SGD0.19 | SGD37.85M | ✅ 4 ⚠️ 3 View Analysis > |
| Yangzijiang Shipbuilding (Holdings) (SGX:BS6) | SGD2.23 | SGD8.78B | ✅ 5 ⚠️ 0 View Analysis > |
| Bosideng International Holdings (SEHK:3998) | HK$4.02 | HK$46.02B | ✅ 4 ⚠️ 1 View Analysis > |
| Lever Style (SEHK:1346) | HK$1.06 | HK$668.81M | ✅ 4 ⚠️ 2 View Analysis > |
| Goodbaby International Holdings (SEHK:1086) | HK$1.11 | HK$1.85B | ✅ 4 ⚠️ 2 View Analysis > |
| TK Group (Holdings) (SEHK:2283) | HK$1.90 | HK$1.58B | ✅ 4 ⚠️ 1 View Analysis > |
Click here to see the full list of 1,163 stocks from our Asian Penny Stocks screener.
Let's take a closer look at a couple of our picks from the screened companies.
Aurora OptoelectronicsLtd (SHSE:600666)
Simply Wall St Financial Health Rating: ★★★★☆☆
Overview: Aurora Optoelectronics Co., Ltd. focuses on the research, development, production, and sale of sapphire crystal materials in China with a market cap of CN¥7.10 billion.
Operations: Aurora Optoelectronics Co., Ltd. has not reported any specific revenue segments.
Market Cap: CN¥7.1B
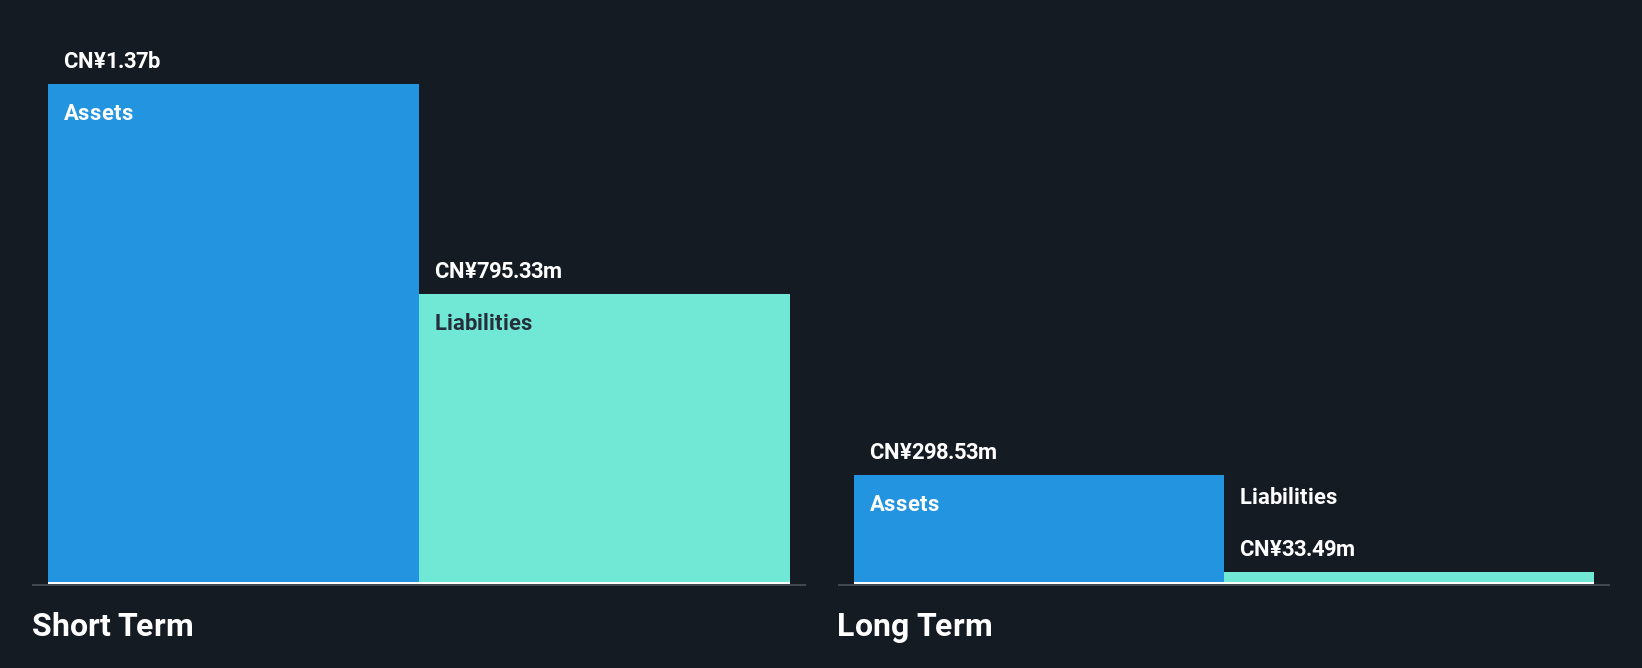
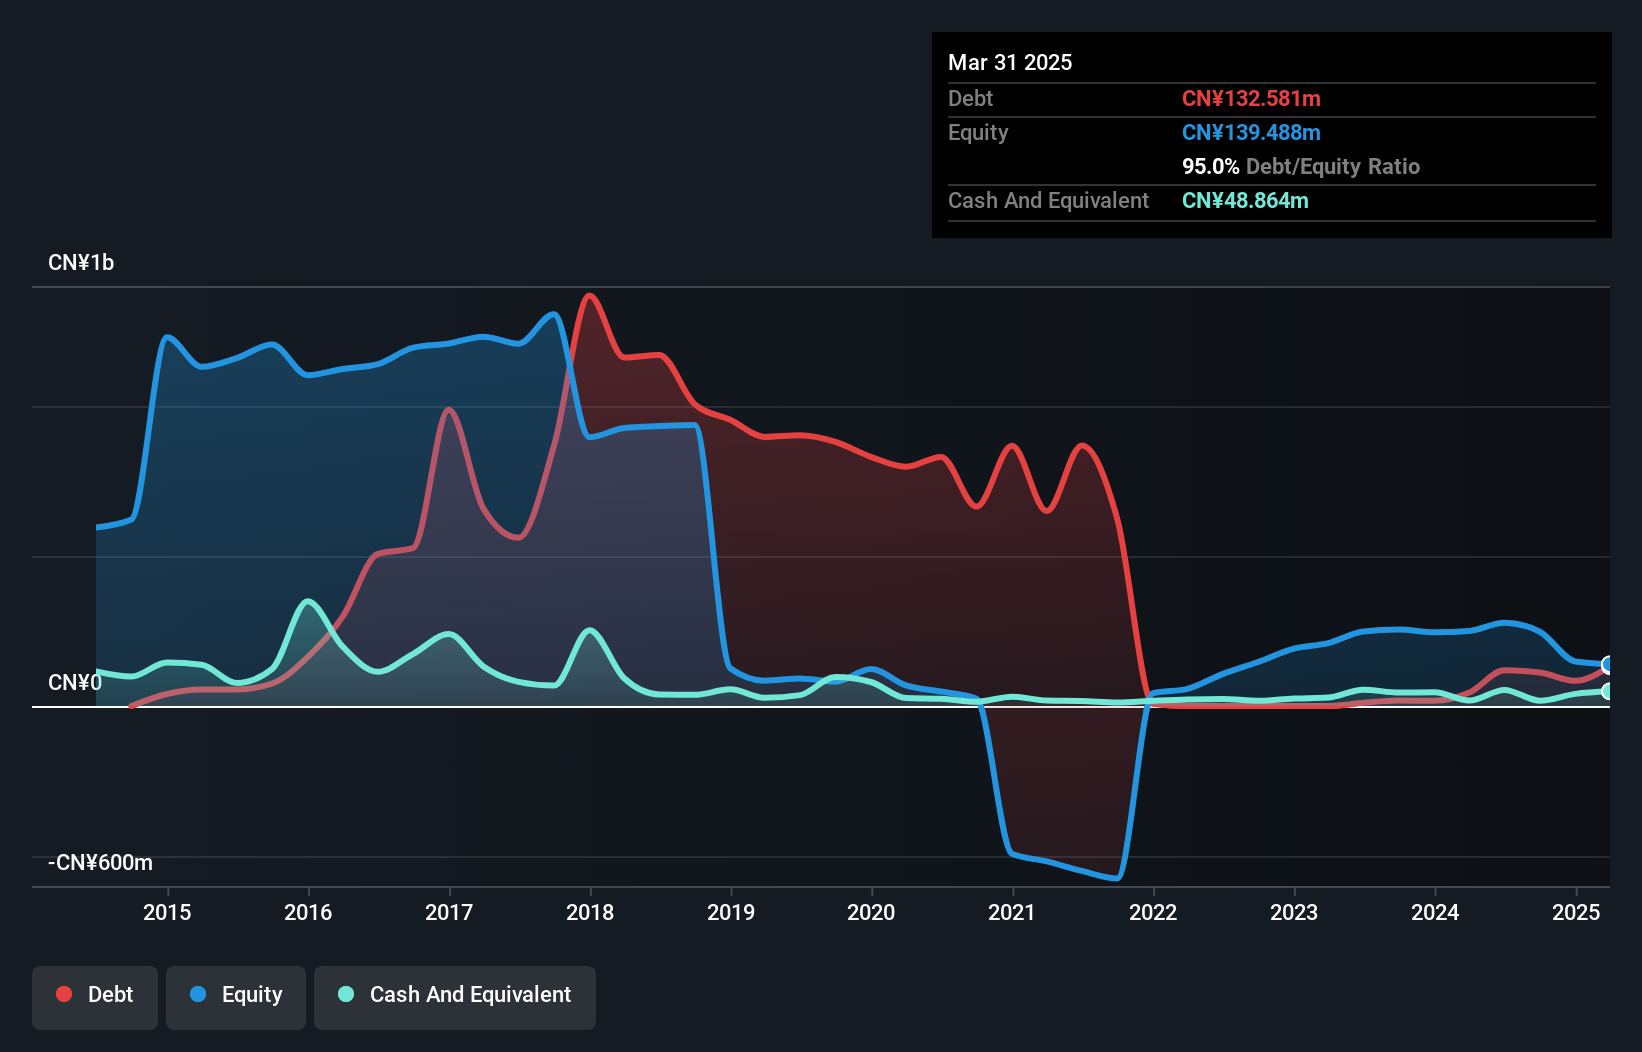
Aurora Optoelectronics Ltd., with a market cap of CN¥7.10 billion, has shown some improvement in its financial performance despite being unprofitable. Recent earnings reports reveal that first-quarter sales increased to CN¥98.38 million from CN¥87.27 million the previous year, while net losses narrowed significantly from CNY 16.05 million to CNY 8.33 million year-on-year. The company’s short-term assets exceed both its short and long-term liabilities, providing some financial stability amid high share price volatility and a limited cash runway of less than one year based on current free cash flow trends.
- Navigate through the intricacies of Aurora OptoelectronicsLtd with our comprehensive balance sheet health report here.
- Explore historical data to track Aurora OptoelectronicsLtd's performance over time in our past results report.

H&R Century Union (SZSE:000892)
Simply Wall St Financial Health Rating: ★★★★☆☆
Overview: H&R Century Union Corporation operates in China, focusing on drama series production and artist brokerage, with a market cap of CN¥3.50 billion.
Operations: H&R Century Union Corporation has not reported any specific revenue segments.
Market Cap: CN¥3.5B
H&R Century Union Corporation, with a market cap of CN¥3.50 billion, has shown progress in reducing losses over the past five years despite remaining unprofitable. Recent earnings reports indicate first-quarter sales rose to CN¥85.55 million from CN¥71.85 million year-on-year, though net loss stood at CN¥4.07 million compared to a net income previously reported. The company maintains more cash than its total debt and its short-term assets exceed both short and long-term liabilities, offering some financial resilience amidst high share price volatility and an experienced management team averaging 4.6 years tenure but an inexperienced board with 2.3 years tenure on average.
- Get an in-depth perspective on H&R Century Union's performance by reading our balance sheet health report here.
- Gain insights into H&R Century Union's past trends and performance with our report on the company's historical track record.
FS Development Investment Holdings (SZSE:300071)
Simply Wall St Financial Health Rating: ★★★★☆☆
Overview: FS Development Investment Holdings, with a market cap of CN¥4.72 billion, offers marketing services in China.
Operations: The company's revenue is primarily derived from its Automotive segment (CN¥997.10 million), with additional contributions from IT Products (CN¥41.59 million), Communication Service (CN¥65.75 million), Retail and Services (CN¥49.74 million), Consumer Electronics Products (CN¥29.34 million), Network Service (CN¥15.01 million), Food and Beverage (CN¥12.96 million), Financial Service (CN¥6.25 million), Real Estate (CN¥2.18 million) and Non-Enterprise sectors (CN¥1.08 million).
Market Cap: CN¥4.72B
FS Development Investment Holdings, with a market cap of CN¥4.72 billion, has seen its revenue decline to CN¥285.77 million in Q1 2025 from CN¥363.05 million the previous year, alongside an increased net loss of CN¥8.71 million compared to CN¥1.55 million a year ago. Despite being unprofitable, it has reduced its debt significantly over five years and maintains short-term assets exceeding liabilities. The company faces high share price volatility and less than one year of cash runway based on current free cash flow trends, while benefiting from an experienced management team with an average tenure of 3.9 years.
- Click to explore a detailed breakdown of our findings in FS Development Investment Holdings' financial health report.
- Understand FS Development Investment Holdings' track record by examining our performance history report.
Where To Now?
- Navigate through the entire inventory of 1,163 Asian Penny Stocks here.
- Contemplating Other Strategies? Diversify your portfolio with solid dividend payers offering reliable income streams to weather potential market turbulence.
This article by Simply Wall St is general in nature. We provide commentary based on historical data and analyst forecasts only using an unbiased methodology and our articles are not intended to be financial advice. It does not constitute a recommendation to buy or sell any stock, and does not take account of your objectives, or your financial situation. We aim to bring you long-term focused analysis driven by fundamental data. Note that our analysis may not factor in the latest price-sensitive company announcements or qualitative material. Simply Wall St has no position in any stocks mentioned.
New: Manage All Your Stock Portfolios in One Place
We've created the ultimate portfolio companion for stock investors, and it's free.
• Connect an unlimited number of Portfolios and see your total in one currency
• Be alerted to new Warning Signs or Risks via email or mobile
• Track the Fair Value of your stocks
Have feedback on this article? Concerned about the content? Get in touch with us directly. Alternatively, email editorial-team@simplywallst.com
About SHSE:600666
Aurora OptoelectronicsLtd
Engages in the research and development, production, and sale of sapphire crystal materials in China.
Adequate balance sheet low.
Similar Companies
Market Insights

Advertisement
Community Narratives

BMW cruising ahead with new EVs and premium models to boost revenue 5%
Fair Value €135.07|44.6% undervalued
UN
Community Contributor
EU#2 - From Humble Beginnings to Global Powerhouse
Fair Value DKK 851.04|46.2% undervalued
TO
Community Contributor