
Advertisement
- China
- /
- Entertainment
- /
- SZSE:002354
Positive Sentiment Still Eludes Tianyu Digital Technology (Dalian) Group Co., Ltd. (SZSE:002354) Following 28% Share Price Slump
The Tianyu Digital Technology (Dalian) Group Co., Ltd. (SZSE:002354) share price has fared very poorly over the last month, falling by a substantial 28%. Instead of being rewarded, shareholders who have already held through the last twelve months are now sitting on a 28% share price drop.
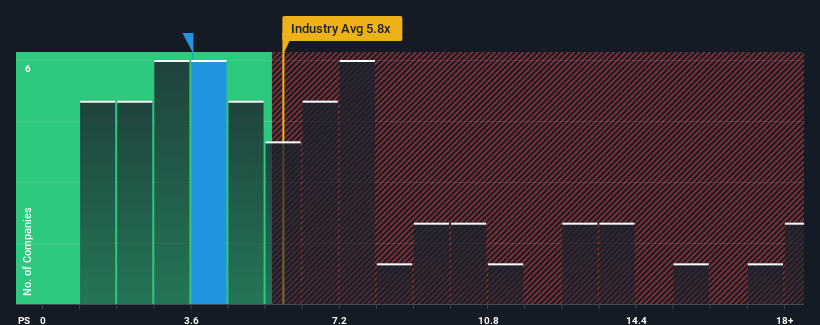
After such a large drop in price, Tianyu Digital Technology (Dalian) Group may be sending buy signals at present with its price-to-sales (or "P/S") ratio of 3.6x, considering almost half of all companies in the Entertainment industry in China have P/S ratios greater than 5.8x and even P/S higher than 9x aren't out of the ordinary. However, the P/S might be low for a reason and it requires further investigation to determine if it's justified.
See our latest analysis for Tianyu Digital Technology (Dalian) Group
What Does Tianyu Digital Technology (Dalian) Group's Recent Performance Look Like?
Tianyu Digital Technology (Dalian) Group could be doing better as its revenue has been going backwards lately while most other companies have been seeing positive revenue growth. The P/S ratio is probably low because investors think this poor revenue performance isn't going to get any better. So while you could say the stock is cheap, investors will be looking for improvement before they see it as good value.
If you'd like to see what analysts are forecasting going forward, you should check out our free report on Tianyu Digital Technology (Dalian) Group.Do Revenue Forecasts Match The Low P/S Ratio?
The only time you'd be truly comfortable seeing a P/S as low as Tianyu Digital Technology (Dalian) Group's is when the company's growth is on track to lag the industry.
In reviewing the last year of financials, we were disheartened to see the company's revenues fell to the tune of 6.2%. Still, the latest three year period has seen an excellent 70% overall rise in revenue, in spite of its unsatisfying short-term performance. So we can start by confirming that the company has generally done a very good job of growing revenue over that time, even though it had some hiccups along the way.
Turning to the outlook, the next year should generate growth of 29% as estimated by the sole analyst watching the company. With the industry only predicted to deliver 22%, the company is positioned for a stronger revenue result.
With this information, we find it odd that Tianyu Digital Technology (Dalian) Group is trading at a P/S lower than the industry. Apparently some shareholders are doubtful of the forecasts and have been accepting significantly lower selling prices.
The Bottom Line On Tianyu Digital Technology (Dalian) Group's P/S
The southerly movements of Tianyu Digital Technology (Dalian) Group's shares means its P/S is now sitting at a pretty low level. While the price-to-sales ratio shouldn't be the defining factor in whether you buy a stock or not, it's quite a capable barometer of revenue expectations.
To us, it seems Tianyu Digital Technology (Dalian) Group currently trades on a significantly depressed P/S given its forecasted revenue growth is higher than the rest of its industry. There could be some major risk factors that are placing downward pressure on the P/S ratio. While the possibility of the share price plunging seems unlikely due to the high growth forecasted for the company, the market does appear to have some hesitation.
You should always think about risks. Case in point, we've spotted 1 warning sign for Tianyu Digital Technology (Dalian) Group you should be aware of.
If companies with solid past earnings growth is up your alley, you may wish to see this free collection of other companies with strong earnings growth and low P/E ratios.
Valuation is complex, but we're here to simplify it.
Discover if Tianyu Digital Technology (Dalian) Group might be undervalued or overvalued with our detailed analysis, featuring fair value estimates, potential risks, dividends, insider trades, and its financial condition.
Access Free AnalysisHave feedback on this article? Concerned about the content? Get in touch with us directly. Alternatively, email editorial-team (at) simplywallst.com.
This article by Simply Wall St is general in nature. We provide commentary based on historical data and analyst forecasts only using an unbiased methodology and our articles are not intended to be financial advice. It does not constitute a recommendation to buy or sell any stock, and does not take account of your objectives, or your financial situation. We aim to bring you long-term focused analysis driven by fundamental data. Note that our analysis may not factor in the latest price-sensitive company announcements or qualitative material. Simply Wall St has no position in any stocks mentioned.
About SZSE:002354
Tianyu Digital Technology (Dalian) Group
Tianyu Digital Technology (Dalian) Group Co., Ltd.
Flawless balance sheet with moderate growth potential.
Market Insights

Advertisement
Community Narratives
MINISO's fair value is projected at 26.69 with an anticipated PE ratio shift of 20x
Fair Value US$24.03|11.0% undervalued
BE
Community Contributor
Procter & Gamble: A Dividend Giant Facing Slowing Growth
Fair Value US$119.81|23.3% overvalued
AN
Community Contributor
Eli Lilly's Future Growth Driven by Tirzepatide and Favorable Market Conditions
Fair Value US$1.19k|13.8% undervalued
EA
Community Contributor