- China
- /
- Interactive Media and Services
- /
- SZSE:000681
Visual China Group Co.,Ltd.'s (SZSE:000681) Stock is Soaring But Financials Seem Inconsistent: Will The Uptrend Continue?


Most readers would already be aware that Visual China GroupLtd's (SZSE:000681) stock increased significantly by 69% over the past three months. However, we wonder if the company's inconsistent financials would have any adverse impact on the current share price momentum. Specifically, we decided to study Visual China GroupLtd's ROE in this article.
Return on equity or ROE is a key measure used to assess how efficiently a company's management is utilizing the company's capital. Simply put, it is used to assess the profitability of a company in relation to its equity capital.
Check out our latest analysis for Visual China GroupLtd
How Do You Calculate Return On Equity?
Return on equity can be calculated by using the formula:
Return on Equity = Net Profit (from continuing operations) ÷ Shareholders' Equity
So, based on the above formula, the ROE for Visual China GroupLtd is:
3.3% = CN¥115m ÷ CN¥3.5b (Based on the trailing twelve months to September 2024).
The 'return' is the profit over the last twelve months. Another way to think of that is that for every CN¥1 worth of equity, the company was able to earn CN¥0.03 in profit.
What Has ROE Got To Do With Earnings Growth?
Thus far, we have learned that ROE measures how efficiently a company is generating its profits. We now need to evaluate how much profit the company reinvests or "retains" for future growth which then gives us an idea about the growth potential of the company. Assuming everything else remains unchanged, the higher the ROE and profit retention, the higher the growth rate of a company compared to companies that don't necessarily bear these characteristics.
Visual China GroupLtd's Earnings Growth And 3.3% ROE
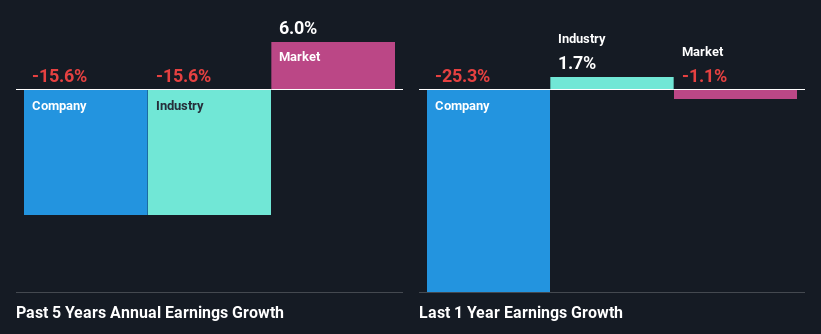
It is hard to argue that Visual China GroupLtd's ROE is much good in and of itself. Even compared to the average industry ROE of 6.8%, the company's ROE is quite dismal. Therefore, it might not be wrong to say that the five year net income decline of 16% seen by Visual China GroupLtd was possibly a result of it having a lower ROE. We believe that there also might be other aspects that are negatively influencing the company's earnings prospects. Such as - low earnings retention or poor allocation of capital.
From the 16% decline reported by the industry in the same period, we infer that Visual China GroupLtd and its industry are both shrinking at a similar rate.
The basis for attaching value to a company is, to a great extent, tied to its earnings growth. It’s important for an investor to know whether the market has priced in the company's expected earnings growth (or decline). Doing so will help them establish if the stock's future looks promising or ominous. If you're wondering about Visual China GroupLtd's's valuation, check out this gauge of its price-to-earnings ratio, as compared to its industry.
Is Visual China GroupLtd Making Efficient Use Of Its Profits?
When we piece together Visual China GroupLtd's low three-year median payout ratio of 11% (where it is retaining 89% of its profits), calculated for the last three-year period, we are puzzled by the lack of growth. The low payout should mean that the company is retaining most of its earnings and consequently, should see some growth. It looks like there might be some other reasons to explain the lack in that respect. For example, the business could be in decline.
In addition, Visual China GroupLtd has been paying dividends over a period of seven years suggesting that keeping up dividend payments is preferred by the management even though earnings have been in decline.
Conclusion
On the whole, we feel that the performance shown by Visual China GroupLtd can be open to many interpretations. While the company does have a high rate of profit retention, its low rate of return is probably hampering its earnings growth. Having said that, looking at current analyst estimates, we found that the company's earnings growth rate is expected to see a huge improvement. To know more about the latest analysts predictions for the company, check out this visualization of analyst forecasts for the company.
New: Manage All Your Stock Portfolios in One Place
We've created the ultimate portfolio companion for stock investors, and it's free.
• Connect an unlimited number of Portfolios and see your total in one currency
• Be alerted to new Warning Signs or Risks via email or mobile
• Track the Fair Value of your stocks
Have feedback on this article? Concerned about the content? Get in touch with us directly. Alternatively, email editorial-team (at) simplywallst.com.
This article by Simply Wall St is general in nature. We provide commentary based on historical data and analyst forecasts only using an unbiased methodology and our articles are not intended to be financial advice. It does not constitute a recommendation to buy or sell any stock, and does not take account of your objectives, or your financial situation. We aim to bring you long-term focused analysis driven by fundamental data. Note that our analysis may not factor in the latest price-sensitive company announcements or qualitative material. Simply Wall St has no position in any stocks mentioned.
About SZSE:000681
Visual China GroupLtd
Provides internet media and other services in China and internationally.
Flawless balance sheet with moderate growth potential.
Similar Companies
Market Insights

Community Narratives


