
Advertisement
What You Can Learn From Hangzhou Heshun Technology Co.,LTD.'s (SZSE:301237) P/SAfter Its 27% Share Price Crash

Hangzhou Heshun Technology Co.,LTD. (SZSE:301237) shareholders won't be pleased to see that the share price has had a very rough month, dropping 27% and undoing the prior period's positive performance. The drop over the last 30 days has capped off a tough year for shareholders, with the share price down 35% in that time.
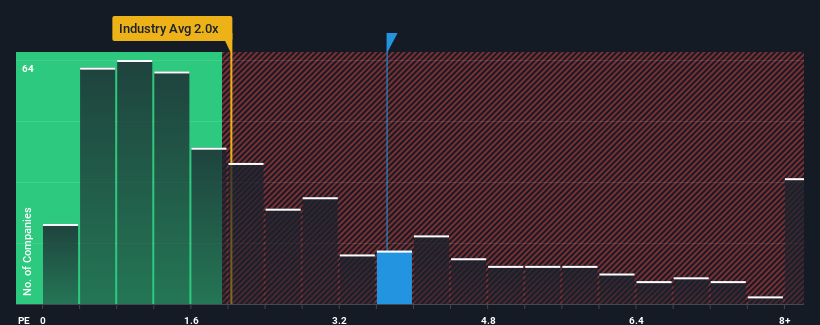
Even after such a large drop in price, when almost half of the companies in China's Chemicals industry have price-to-sales ratios (or "P/S") below 2x, you may still consider Hangzhou Heshun TechnologyLTD as a stock probably not worth researching with its 3.7x P/S ratio. Although, it's not wise to just take the P/S at face value as there may be an explanation why it's as high as it is.
See our latest analysis for Hangzhou Heshun TechnologyLTD
What Does Hangzhou Heshun TechnologyLTD's P/S Mean For Shareholders?
Hangzhou Heshun TechnologyLTD hasn't been tracking well recently as its declining revenue compares poorly to other companies, which have seen some growth in their revenues on average. One possibility is that the P/S ratio is high because investors think this poor revenue performance will turn the corner. If not, then existing shareholders may be extremely nervous about the viability of the share price.
If you'd like to see what analysts are forecasting going forward, you should check out our free report on Hangzhou Heshun TechnologyLTD.What Are Revenue Growth Metrics Telling Us About The High P/S?
Hangzhou Heshun TechnologyLTD's P/S ratio would be typical for a company that's expected to deliver solid growth, and importantly, perform better than the industry.
Retrospectively, the last year delivered a frustrating 16% decrease to the company's top line. This has soured the latest three-year period, which nevertheless managed to deliver a decent 12% overall rise in revenue. Accordingly, while they would have preferred to keep the run going, shareholders would be roughly satisfied with the medium-term rates of revenue growth.
Shifting to the future, estimates from the dual analysts covering the company suggest revenue should grow by 44% per year over the next three years. Meanwhile, the rest of the industry is forecast to only expand by 13% per annum, which is noticeably less attractive.
In light of this, it's understandable that Hangzhou Heshun TechnologyLTD's P/S sits above the majority of other companies. It seems most investors are expecting this strong future growth and are willing to pay more for the stock.
What Does Hangzhou Heshun TechnologyLTD's P/S Mean For Investors?
Hangzhou Heshun TechnologyLTD's P/S remain high even after its stock plunged. While the price-to-sales ratio shouldn't be the defining factor in whether you buy a stock or not, it's quite a capable barometer of revenue expectations.
As we suspected, our examination of Hangzhou Heshun TechnologyLTD's analyst forecasts revealed that its superior revenue outlook is contributing to its high P/S. It appears that shareholders are confident in the company's future revenues, which is propping up the P/S. Unless the analysts have really missed the mark, these strong revenue forecasts should keep the share price buoyant.
We don't want to rain on the parade too much, but we did also find 4 warning signs for Hangzhou Heshun TechnologyLTD (3 are potentially serious!) that you need to be mindful of.
It's important to make sure you look for a great company, not just the first idea you come across. So if growing profitability aligns with your idea of a great company, take a peek at this free list of interesting companies with strong recent earnings growth (and a low P/E).
Valuation is complex, but we're here to simplify it.
Discover if Hangzhou Heshun TechnologyLTD might be undervalued or overvalued with our detailed analysis, featuring fair value estimates, potential risks, dividends, insider trades, and its financial condition.
Access Free AnalysisHave feedback on this article? Concerned about the content? Get in touch with us directly. Alternatively, email editorial-team (at) simplywallst.com.
This article by Simply Wall St is general in nature. We provide commentary based on historical data and analyst forecasts only using an unbiased methodology and our articles are not intended to be financial advice. It does not constitute a recommendation to buy or sell any stock, and does not take account of your objectives, or your financial situation. We aim to bring you long-term focused analysis driven by fundamental data. Note that our analysis may not factor in the latest price-sensitive company announcements or qualitative material. Simply Wall St has no position in any stocks mentioned.
About SZSE:301237
Hangzhou Heshun TechnologyLTD
Engages in development, production, and sale of differentiated and functional polyester films in China and internationally.
Adequate balance sheet minimal.
Market Insights


Advertisement
Community Narratives
The Future of Drug Testing? Fingerprint Tech Shows Serious Promise
Fair Value US$2.98|40.3% undervalued
JO
Community Contributor
Suncorp’s Next Chapter: Insurance-Only and Ready to Grow
Fair Value AU$22.83|7.9% undervalued
RO
Community Contributor
Thyssenkrupp Nucera Will Achieve Double-Digit Profits by 2030 Boosted by Hydrogen Growth
Fair Value €14.40|31.3% undervalued
CH
Community Contributor
Tesla’s Nvidia Moment – The AI & Robotics Inflection Point
Fair Value US$359.72|12.3% undervalued
BL
Community Contributor