Stock Analysis
The total return for Chengdu Guibao Science & TechnologyLtd (SZSE:300019) investors has risen faster than earnings growth over the last five years


It hasn't been the best quarter for Chengdu Guibao Science & Technology Co.,Ltd. (SZSE:300019) shareholders, since the share price has fallen 20% in that time. On the bright side the returns have been quite good over the last half decade. After all, the share price is up a market-beating 64% in that time. While the long term returns are impressive, we do have some sympathy for those who bought more recently, given the 26% drop, in the last year.
Although Chengdu Guibao Science & TechnologyLtd has shed CN¥415m from its market cap this week, let's take a look at its longer term fundamental trends and see if they've driven returns.
See our latest analysis for Chengdu Guibao Science & TechnologyLtd
While markets are a powerful pricing mechanism, share prices reflect investor sentiment, not just underlying business performance. By comparing earnings per share (EPS) and share price changes over time, we can get a feel for how investor attitudes to a company have morphed over time.
During five years of share price growth, Chengdu Guibao Science & TechnologyLtd achieved compound earnings per share (EPS) growth of 26% per year. The EPS growth is more impressive than the yearly share price gain of 10% over the same period. So one could conclude that the broader market has become more cautious towards the stock.
The company's earnings per share (over time) is depicted in the image below (click to see the exact numbers).
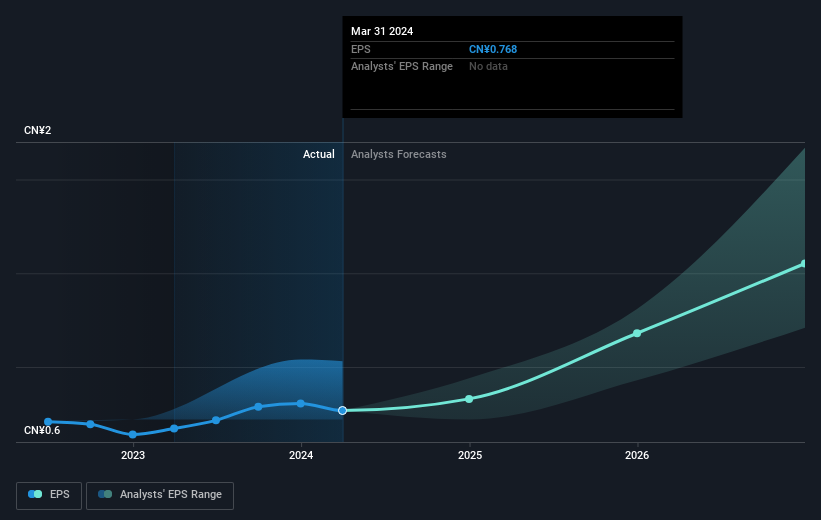
We know that Chengdu Guibao Science & TechnologyLtd has improved its bottom line lately, but is it going to grow revenue? Check if analysts think Chengdu Guibao Science & TechnologyLtd will grow revenue in the future.
What About Dividends?
As well as measuring the share price return, investors should also consider the total shareholder return (TSR). The TSR is a return calculation that accounts for the value of cash dividends (assuming that any dividend received was reinvested) and the calculated value of any discounted capital raisings and spin-offs. It's fair to say that the TSR gives a more complete picture for stocks that pay a dividend. We note that for Chengdu Guibao Science & TechnologyLtd the TSR over the last 5 years was 79%, which is better than the share price return mentioned above. And there's no prize for guessing that the dividend payments largely explain the divergence!
A Different Perspective
We regret to report that Chengdu Guibao Science & TechnologyLtd shareholders are down 25% for the year (even including dividends). Unfortunately, that's worse than the broader market decline of 17%. Having said that, it's inevitable that some stocks will be oversold in a falling market. The key is to keep your eyes on the fundamental developments. On the bright side, long term shareholders have made money, with a gain of 12% per year over half a decade. If the fundamental data continues to indicate long term sustainable growth, the current sell-off could be an opportunity worth considering. While it is well worth considering the different impacts that market conditions can have on the share price, there are other factors that are even more important. Even so, be aware that Chengdu Guibao Science & TechnologyLtd is showing 1 warning sign in our investment analysis , you should know about...
Of course Chengdu Guibao Science & TechnologyLtd may not be the best stock to buy. So you may wish to see this free collection of growth stocks.
Please note, the market returns quoted in this article reflect the market weighted average returns of stocks that currently trade on Chinese exchanges.
New: AI Stock Screener & Alerts
Our new AI Stock Screener scans the market every day to uncover opportunities.
• Dividend Powerhouses (3%+ Yield)
• Undervalued Small Caps with Insider Buying
• High growth Tech and AI Companies
Or build your own from over 50 metrics.
Have feedback on this article? Concerned about the content? Get in touch with us directly. Alternatively, email editorial-team (at) simplywallst.com.
This article by Simply Wall St is general in nature. We provide commentary based on historical data and analyst forecasts only using an unbiased methodology and our articles are not intended to be financial advice. It does not constitute a recommendation to buy or sell any stock, and does not take account of your objectives, or your financial situation. We aim to bring you long-term focused analysis driven by fundamental data. Note that our analysis may not factor in the latest price-sensitive company announcements or qualitative material. Simply Wall St has no position in any stocks mentioned.
Have feedback on this article? Concerned about the content? Get in touch with us directly. Alternatively, email editorial-team@simplywallst.com
About SZSE:300019
Chengdu Guibao Science & TechnologyLtd
Chengdu Guibao Science & Technology Co.,Ltd.
Undervalued with high growth potential and pays a dividend.
