
Advertisement
Suzhou Hycan Holdings Co., Ltd. (SZSE:002787) Shares Fly 42% But Investors Aren't Buying For Growth

Suzhou Hycan Holdings Co., Ltd. (SZSE:002787) shareholders are no doubt pleased to see that the share price has bounced 42% in the last month, although it is still struggling to make up recently lost ground. Unfortunately, the gains of the last month did little to right the losses of the last year with the stock still down 17% over that time.
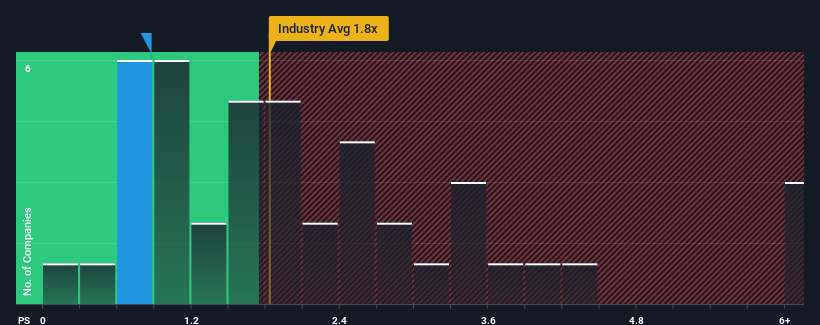
In spite of the firm bounce in price, when close to half the companies operating in China's Packaging industry have price-to-sales ratios (or "P/S") above 1.8x, you may still consider Suzhou Hycan Holdings as an enticing stock to check out with its 0.9x P/S ratio. Although, it's not wise to just take the P/S at face value as there may be an explanation why it's limited.
Check out our latest analysis for Suzhou Hycan Holdings
How Has Suzhou Hycan Holdings Performed Recently?
For example, consider that Suzhou Hycan Holdings' financial performance has been pretty ordinary lately as revenue growth is non-existent. Perhaps the market believes the recent lacklustre revenue performance is a sign of future underperformance relative to industry peers, hurting the P/S. If you like the company, you'd be hoping this isn't the case so that you could potentially pick up some stock while it's out of favour.
We don't have analyst forecasts, but you can see how recent trends are setting up the company for the future by checking out our free report on Suzhou Hycan Holdings' earnings, revenue and cash flow.Do Revenue Forecasts Match The Low P/S Ratio?
Suzhou Hycan Holdings' P/S ratio would be typical for a company that's only expected to deliver limited growth, and importantly, perform worse than the industry.
Retrospectively, the last year delivered virtually the same number to the company's top line as the year before. Still, the latest three year period has seen an excellent 37% overall rise in revenue, in spite of its uninspiring short-term performance. So while the company has done a solid job in the past, it's somewhat concerning to see revenue growth decline as much as it has.
Comparing the recent medium-term revenue trends against the industry's one-year growth forecast of 21% shows it's noticeably less attractive.
With this in consideration, it's easy to understand why Suzhou Hycan Holdings' P/S falls short of the mark set by its industry peers. It seems most investors are expecting to see the recent limited growth rates continue into the future and are only willing to pay a reduced amount for the stock.
What We Can Learn From Suzhou Hycan Holdings' P/S?
Suzhou Hycan Holdings' stock price has surged recently, but its but its P/S still remains modest. We'd say the price-to-sales ratio's power isn't primarily as a valuation instrument but rather to gauge current investor sentiment and future expectations.
In line with expectations, Suzhou Hycan Holdings maintains its low P/S on the weakness of its recent three-year growth being lower than the wider industry forecast. At this stage investors feel the potential for an improvement in revenue isn't great enough to justify a higher P/S ratio. Unless the recent medium-term conditions improve, they will continue to form a barrier for the share price around these levels.
You need to take note of risks, for example - Suzhou Hycan Holdings has 2 warning signs (and 1 which is a bit concerning) we think you should know about.
If you're unsure about the strength of Suzhou Hycan Holdings' business, why not explore our interactive list of stocks with solid business fundamentals for some other companies you may have missed.
New: Manage All Your Stock Portfolios in One Place
We've created the ultimate portfolio companion for stock investors, and it's free.
• Connect an unlimited number of Portfolios and see your total in one currency
• Be alerted to new Warning Signs or Risks via email or mobile
• Track the Fair Value of your stocks
Have feedback on this article? Concerned about the content? Get in touch with us directly. Alternatively, email editorial-team (at) simplywallst.com.
This article by Simply Wall St is general in nature. We provide commentary based on historical data and analyst forecasts only using an unbiased methodology and our articles are not intended to be financial advice. It does not constitute a recommendation to buy or sell any stock, and does not take account of your objectives, or your financial situation. We aim to bring you long-term focused analysis driven by fundamental data. Note that our analysis may not factor in the latest price-sensitive company announcements or qualitative material. Simply Wall St has no position in any stocks mentioned.
About SZSE:002787
Suzhou Hycan Holdings
Engages in the research and development, design, production, and sale of packaging products in China and internationally.
Flawless balance sheet with proven track record.
Market Insights

Advertisement
Community Narratives
Groundbreaking therapies that could change the treatment landscape for PTSD, fibromyalgia, MS & Alzheimer’s
Fair Value US$6.20|86.8% undervalued
CM
Community Contributor
DigitalOcean Will Grow 14% by Embracing AI with Paperspace Acquisition
Fair Value US$50.00|43.5% undervalued
NE
Community Contributor
Viant Technology: A Rising AdTech Challenger in the AI-Powered CTV Market
Fair Value US$38.61|61.4% undervalued
BL
Community Contributor
Volvo will Accelerate Forward into Electric and Autonomous Leadership in Five Years
Fair Value SEK 438.80|40.8% undervalued
UN
Community Contributor