
Advertisement
- China
- /
- Metals and Mining
- /
- SZSE:002738
Sinomine Resource Group (SZSE:002738) shareholders have earned a 33% CAGR over the last five years
It hasn't been the best quarter for Sinomine Resource Group Co., Ltd. (SZSE:002738) shareholders, since the share price has fallen 10% in that time. But that doesn't change the fact that the returns over the last five years have been very strong. We think most investors would be happy with the 288% return, over that period. Generally speaking the long term returns will give you a better idea of business quality than short periods can. The more important question is whether the stock is too cheap or too expensive today. Unfortunately not all shareholders will have held it for five years, so spare a thought for those caught in the 35% decline over the last three years: that's a long time to wait for profits.
So let's assess the underlying fundamentals over the last 5 years and see if they've moved in lock-step with shareholder returns.
View our latest analysis for Sinomine Resource Group
There is no denying that markets are sometimes efficient, but prices do not always reflect underlying business performance. One imperfect but simple way to consider how the market perception of a company has shifted is to compare the change in the earnings per share (EPS) with the share price movement.
Over half a decade, Sinomine Resource Group managed to grow its earnings per share at 23% a year. This EPS growth is lower than the 31% average annual increase in the share price. So it's fair to assume the market has a higher opinion of the business than it did five years ago. That's not necessarily surprising considering the five-year track record of earnings growth.
The graphic below depicts how EPS has changed over time (unveil the exact values by clicking on the image).
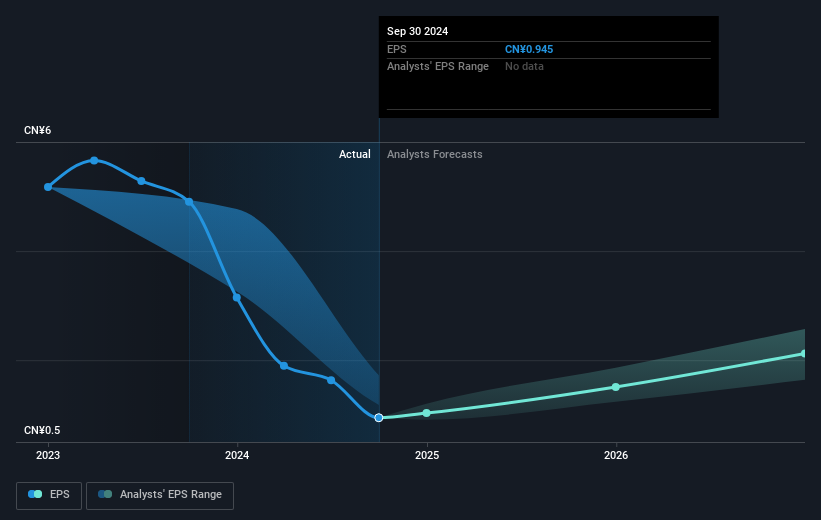
Dive deeper into Sinomine Resource Group's key metrics by checking this interactive graph of Sinomine Resource Group's earnings, revenue and cash flow.
What About Dividends?
When looking at investment returns, it is important to consider the difference between total shareholder return (TSR) and share price return. The TSR incorporates the value of any spin-offs or discounted capital raisings, along with any dividends, based on the assumption that the dividends are reinvested. So for companies that pay a generous dividend, the TSR is often a lot higher than the share price return. We note that for Sinomine Resource Group the TSR over the last 5 years was 308%, which is better than the share price return mentioned above. This is largely a result of its dividend payments!
A Different Perspective
While the broader market gained around 18% in the last year, Sinomine Resource Group shareholders lost 6.4% (even including dividends). Even the share prices of good stocks drop sometimes, but we want to see improvements in the fundamental metrics of a business, before getting too interested. Longer term investors wouldn't be so upset, since they would have made 33%, each year, over five years. If the fundamental data continues to indicate long term sustainable growth, the current sell-off could be an opportunity worth considering. It's always interesting to track share price performance over the longer term. But to understand Sinomine Resource Group better, we need to consider many other factors. For example, we've discovered 3 warning signs for Sinomine Resource Group (2 shouldn't be ignored!) that you should be aware of before investing here.
We will like Sinomine Resource Group better if we see some big insider buys. While we wait, check out this free list of undervalued stocks (mostly small caps) with considerable, recent, insider buying.
Please note, the market returns quoted in this article reflect the market weighted average returns of stocks that currently trade on Chinese exchanges.
New: Manage All Your Stock Portfolios in One Place
We've created the ultimate portfolio companion for stock investors, and it's free.
• Connect an unlimited number of Portfolios and see your total in one currency
• Be alerted to new Warning Signs or Risks via email or mobile
• Track the Fair Value of your stocks
Have feedback on this article? Concerned about the content? Get in touch with us directly. Alternatively, email editorial-team (at) simplywallst.com.
This article by Simply Wall St is general in nature. We provide commentary based on historical data and analyst forecasts only using an unbiased methodology and our articles are not intended to be financial advice. It does not constitute a recommendation to buy or sell any stock, and does not take account of your objectives, or your financial situation. We aim to bring you long-term focused analysis driven by fundamental data. Note that our analysis may not factor in the latest price-sensitive company announcements or qualitative material. Simply Wall St has no position in any stocks mentioned.
About SZSE:002738
Sinomine Resource Group
Engages in the development and utilization of lithium battery new energy raw materials, rare light metals, and solid minerals in China and internationally.
Flawless balance sheet with reasonable growth potential.
Market Insights

Advertisement
Community Narratives
MINISO's fair value is projected at 26.69 with an anticipated PE ratio shift of 20x
Fair Value US$24.03|11.0% undervalued
BE
Community Contributor
Procter & Gamble: A Dividend Giant Facing Slowing Growth
Fair Value US$119.81|23.3% overvalued
AN
Community Contributor
Eli Lilly's Future Growth Driven by Tirzepatide and Favorable Market Conditions
Fair Value US$1.19k|13.8% undervalued
EA
Community Contributor