Sichuan Yahua Industrial Group Co., Ltd.'s (SZSE:002497) Price Is Right But Growth Is Lacking After Shares Rocket 27%

Those holding Sichuan Yahua Industrial Group Co., Ltd. (SZSE:002497) shares would be relieved that the share price has rebounded 27% in the last thirty days, but it needs to keep going to repair the recent damage it has caused to investor portfolios. Still, the 30-day jump doesn't change the fact that longer term shareholders have seen their stock decimated by the 54% share price drop in the last twelve months.
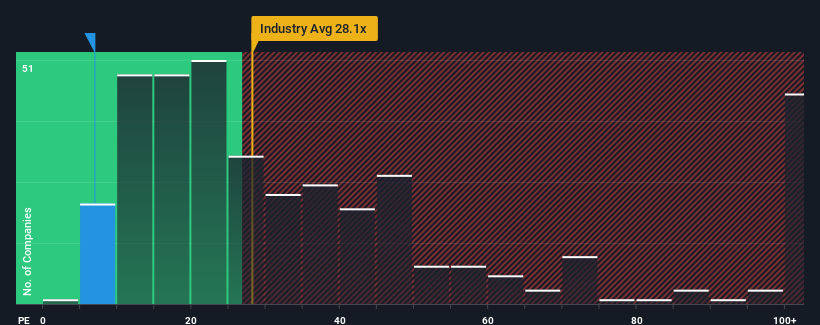
Although its price has surged higher, Sichuan Yahua Industrial Group may still be sending very bullish signals at the moment with its price-to-earnings (or "P/E") ratio of 6.9x, since almost half of all companies in China have P/E ratios greater than 30x and even P/E's higher than 55x are not unusual. Nonetheless, we'd need to dig a little deeper to determine if there is a rational basis for the highly reduced P/E.
With earnings that are retreating more than the market's of late, Sichuan Yahua Industrial Group has been very sluggish. It seems that many are expecting the dismal earnings performance to persist, which has repressed the P/E. If you still like the company, you'd want its earnings trajectory to turn around before making any decisions. Or at the very least, you'd be hoping the earnings slide doesn't get any worse if your plan is to pick up some stock while it's out of favour.
See our latest analysis for Sichuan Yahua Industrial Group

What Are Growth Metrics Telling Us About The Low P/E?
Sichuan Yahua Industrial Group's P/E ratio would be typical for a company that's expected to deliver very poor growth or even falling earnings, and importantly, perform much worse than the market.
If we review the last year of earnings, dishearteningly the company's profits fell to the tune of 53%. Even so, admirably EPS has lifted 906% in aggregate from three years ago, notwithstanding the last 12 months. So we can start by confirming that the company has generally done a very good job of growing earnings over that time, even though it had some hiccups along the way.
Turning to the outlook, the next year should generate growth of 8.7% as estimated by the five analysts watching the company. With the market predicted to deliver 41% growth , the company is positioned for a weaker earnings result.
In light of this, it's understandable that Sichuan Yahua Industrial Group's P/E sits below the majority of other companies. It seems most investors are expecting to see limited future growth and are only willing to pay a reduced amount for the stock.
The Final Word
Even after such a strong price move, Sichuan Yahua Industrial Group's P/E still trails the rest of the market significantly. While the price-to-earnings ratio shouldn't be the defining factor in whether you buy a stock or not, it's quite a capable barometer of earnings expectations.
We've established that Sichuan Yahua Industrial Group maintains its low P/E on the weakness of its forecast growth being lower than the wider market, as expected. Right now shareholders are accepting the low P/E as they concede future earnings probably won't provide any pleasant surprises. It's hard to see the share price rising strongly in the near future under these circumstances.
Having said that, be aware Sichuan Yahua Industrial Group is showing 3 warning signs in our investment analysis, and 1 of those is significant.
It's important to make sure you look for a great company, not just the first idea you come across. So take a peek at this free list of interesting companies with strong recent earnings growth (and a low P/E).
If you're looking to trade Sichuan Yahua Industrial Group, open an account with the lowest-cost platform trusted by professionals, Interactive Brokers.
With clients in over 200 countries and territories, and access to 160 markets, IBKR lets you trade stocks, options, futures, forex, bonds and funds from a single integrated account.
Enjoy no hidden fees, no account minimums, and FX conversion rates as low as 0.03%, far better than what most brokers offer.
Sponsored ContentNew: Manage All Your Stock Portfolios in One Place
We've created the ultimate portfolio companion for stock investors, and it's free.
• Connect an unlimited number of Portfolios and see your total in one currency
• Be alerted to new Warning Signs or Risks via email or mobile
• Track the Fair Value of your stocks
Have feedback on this article? Concerned about the content? Get in touch with us directly. Alternatively, email editorial-team (at) simplywallst.com.
This article by Simply Wall St is general in nature. We provide commentary based on historical data and analyst forecasts only using an unbiased methodology and our articles are not intended to be financial advice. It does not constitute a recommendation to buy or sell any stock, and does not take account of your objectives, or your financial situation. We aim to bring you long-term focused analysis driven by fundamental data. Note that our analysis may not factor in the latest price-sensitive company announcements or qualitative material. Simply Wall St has no position in any stocks mentioned.
About SZSE:002497
Sichuan Yahua Industrial Group
Research, produces, and sells civil explosive, and blasting services in China and internationally.
Excellent balance sheet with reasonable growth potential.
Market Insights
Community Narratives


