Advertisement
- China
- /
- Specialty Stores
- /
- SZSE:002356
October 2025 Asian Penny Stocks To Watch

Simply Wall St
Reviewed by Simply Wall St
As the global markets navigate a complex landscape of trade tensions and monetary policy shifts, Asian markets remain a focal point for investors seeking opportunities in emerging sectors. Penny stocks, while an older term, continue to capture attention by highlighting smaller or less-established companies that may offer significant value. By focusing on those with solid financials and potential for growth, investors can uncover promising opportunities within this segment of the market.
Top 10 Penny Stocks In Asia
| Name | Share Price | Market Cap | Rewards & Risks |
| JBM (Healthcare) (SEHK:2161) | HK$2.92 | HK$2.38B | ✅ 3 ⚠️ 1 View Analysis > |
| Lever Style (SEHK:1346) | HK$1.50 | HK$927.78M | ✅ 4 ⚠️ 1 View Analysis > |
| Asia Medical and Agricultural Laboratory and Research Center (SET:AMARC) | THB2.96 | THB1.24B | ✅ 4 ⚠️ 2 View Analysis > |
| TK Group (Holdings) (SEHK:2283) | HK$2.54 | HK$2.11B | ✅ 4 ⚠️ 1 View Analysis > |
| CNMC Goldmine Holdings (Catalist:5TP) | SGD1.16 | SGD470.14M | ✅ 4 ⚠️ 1 View Analysis > |
| Atlantic Navigation Holdings (Singapore) (Catalist:5UL) | SGD0.094 | SGD49.21M | ✅ 2 ⚠️ 4 View Analysis > |
| Yangzijiang Shipbuilding (Holdings) (SGX:BS6) | SGD3.34 | SGD13.14B | ✅ 5 ⚠️ 1 View Analysis > |
| Anton Oilfield Services Group (SEHK:3337) | HK$1.11 | HK$3B | ✅ 4 ⚠️ 1 View Analysis > |
| Livestock Improvement (NZSE:LIC) | NZ$0.97 | NZ$139.5M | ✅ 2 ⚠️ 5 View Analysis > |
| Rojana Industrial Park (SET:ROJNA) | THB4.32 | THB8.73B | ✅ 3 ⚠️ 3 View Analysis > |
Click here to see the full list of 953 stocks from our Asian Penny Stocks screener.
Underneath we present a selection of stocks filtered out by our screen.
MYS Group (SZSE:002303)
Simply Wall St Financial Health Rating: ★★★★★☆
Overview: MYS Group Co., Ltd. develops, produces, and sells packaging products both in China and internationally with a market cap of CN¥6.99 billion.
Operations: The company's revenue is derived from two segments: CN¥2.82 billion from China and CN¥1.29 billion from exports.
Market Cap: CN¥7B
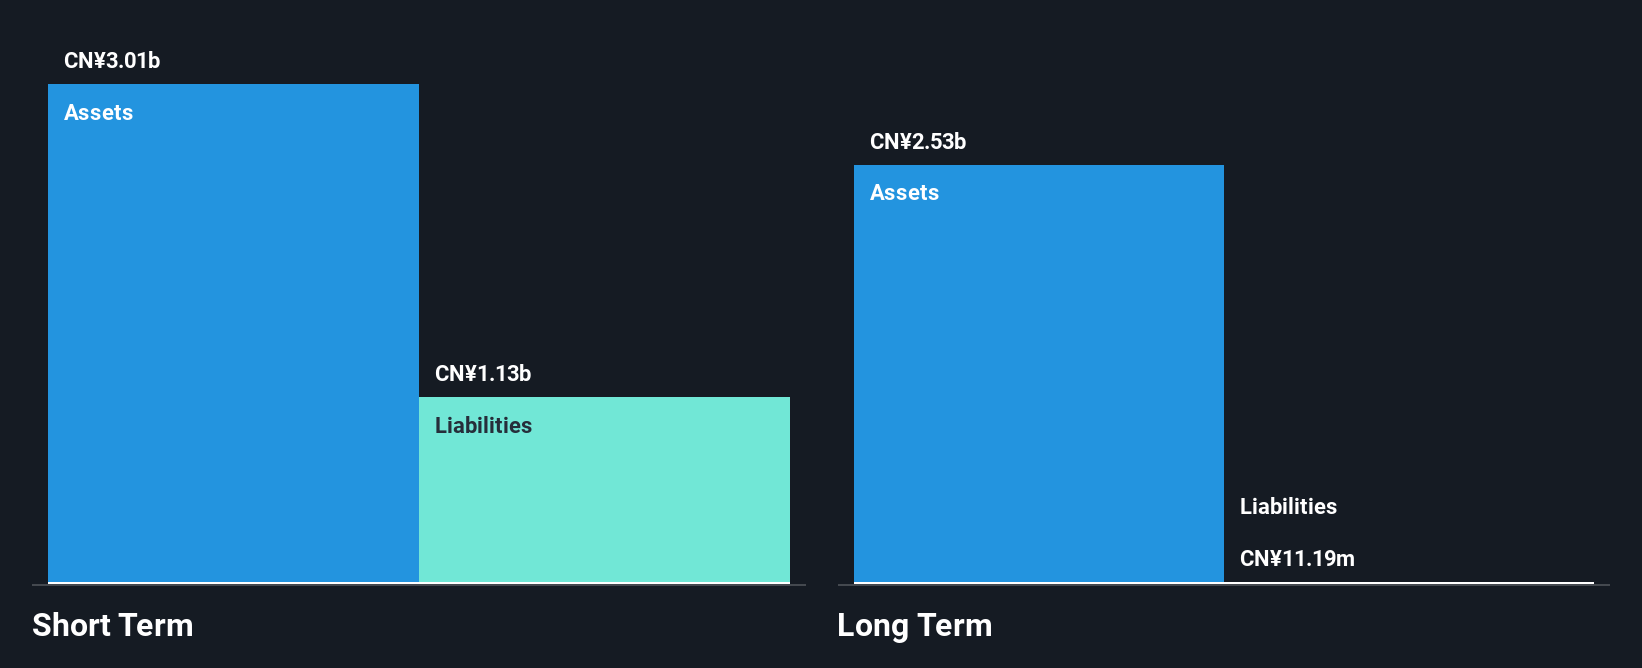
MYS Group has demonstrated solid financial performance with earnings growing by 25.8% over the past year, surpassing its five-year average growth rate of 1.5%. The company's short-term assets significantly exceed both its long-term and short-term liabilities, indicating a strong liquidity position. Despite an increased debt-to-equity ratio from 17.6% to 30.8% over five years, MYS Group's cash reserves are greater than its total debt, ensuring debt is well-covered by operating cash flow at 34.8%. Recent amendments to company bylaws and a dividend increase reflect active management decisions aimed at shareholder value enhancement.
- Click here to discover the nuances of MYS Group with our detailed analytical financial health report.
- Understand MYS Group's track record by examining our performance history report.
Shenzhen Hemei GroupLTD (SZSE:002356)
Simply Wall St Financial Health Rating: ★★★★★★
Overview: Shenzhen Hemei Group Co., LTD. operates in the clothing and accessories sector both within China and internationally, with a market capitalization of CN¥4.80 billion.
Operations: The company's revenue segments include CN¥218.77 million from business operations and CN¥2.16 million from shared bicycle operations.
Market Cap: CN¥4.8B
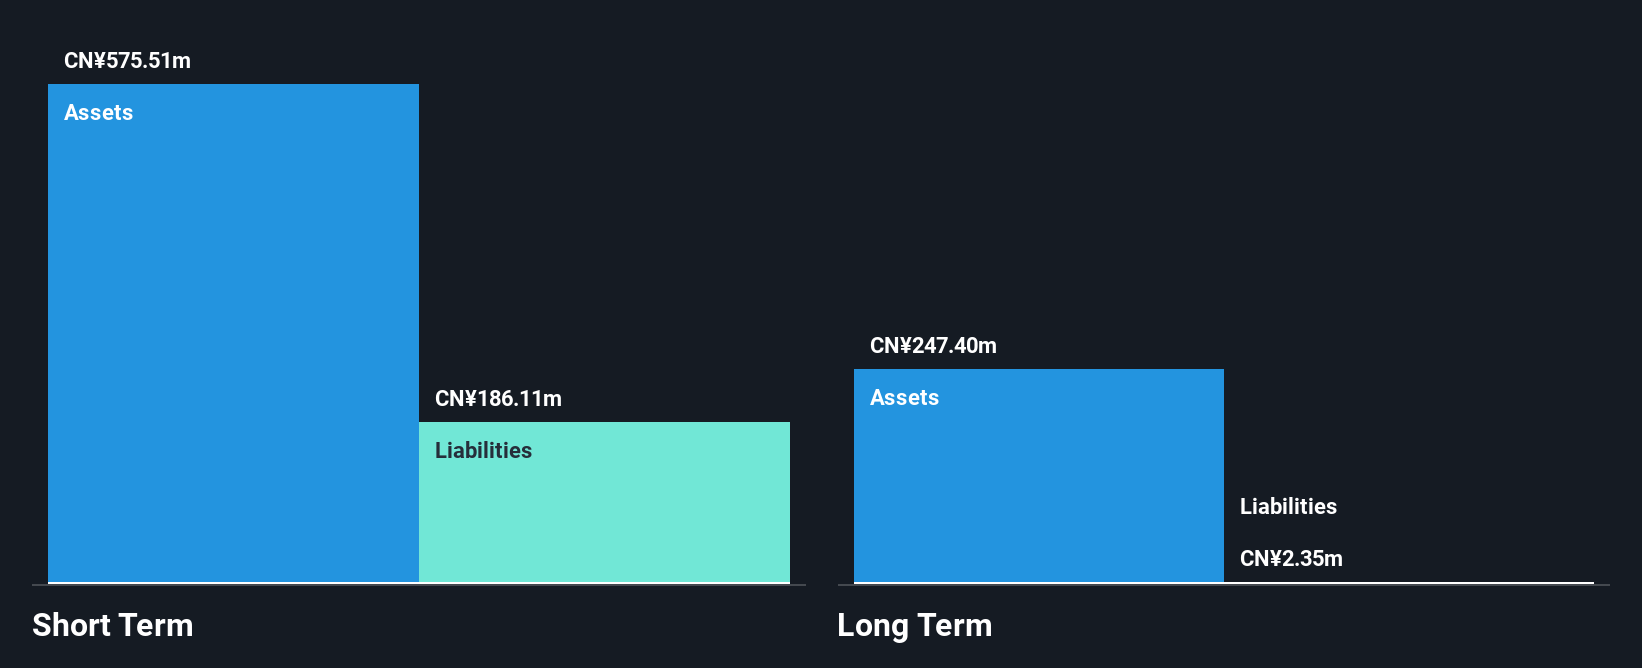
Shenzhen Hemei Group Co., LTD. has shown substantial financial improvement with sales reaching CN¥456.02 million for the nine months ended September 30, 2025, up from CN¥157.14 million a year prior, transitioning from a net loss to a net income of CN¥51.75 million. Despite being unprofitable in the past, it has reduced losses significantly over five years and currently operates debt-free with sufficient cash runway for over a year based on current free cash flow trends. Recent amendments to its articles of association indicate ongoing governance adjustments, potentially influencing future strategic directions.
- Jump into the full analysis health report here for a deeper understanding of Shenzhen Hemei GroupLTD.
- Gain insights into Shenzhen Hemei GroupLTD's historical outcomes by reviewing our past performance report.
B-SOFTLtd (SZSE:300451)
Simply Wall St Financial Health Rating: ★★★★★☆
Overview: B-SOFT Co., Ltd. operates in the medical and health informatization industry in China and has a market cap of CN¥7.29 billion.
Operations: The company generates CN¥1.27 billion in revenue from its operations within China.
Market Cap: CN¥7.29B
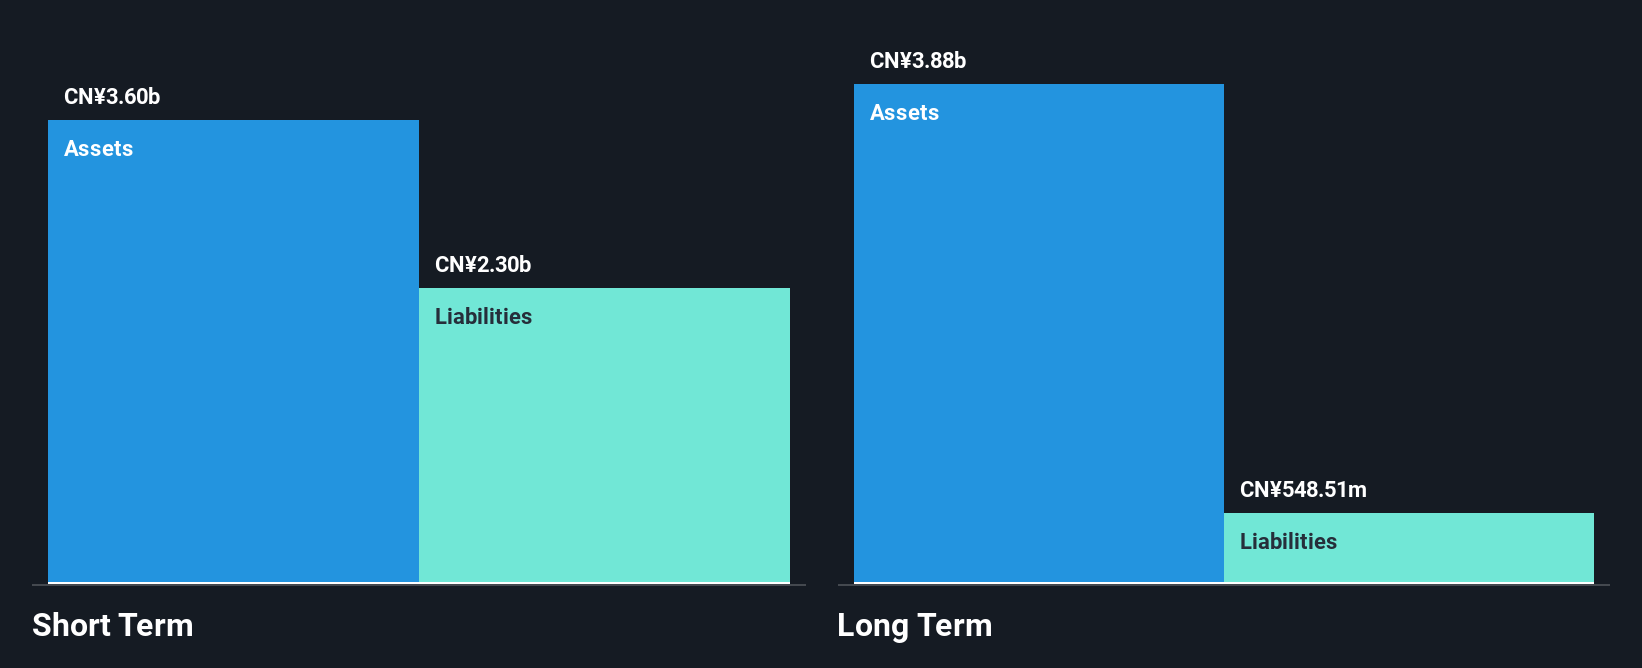
B-SOFT Co., Ltd. faces challenges as it reported a net loss of CN¥80.55 million for the first half of 2025, contrasting with a profit from the previous year. Despite being unprofitable, its financial structure is robust, with short-term assets of CN¥3 billion exceeding both long-term and short-term liabilities. The company’s cash reserves surpass its total debt, and operating cash flow effectively covers its debt obligations. Recent amendments to the company's articles of association and employee stock ownership plans indicate strategic shifts that could impact future operations amidst stable weekly volatility in stock performance over the past year.
- Navigate through the intricacies of B-SOFTLtd with our comprehensive balance sheet health report here.
- Review our growth performance report to gain insights into B-SOFTLtd's future.
Key Takeaways
- Unlock more gems! Our Asian Penny Stocks screener has unearthed 950 more companies for you to explore.Click here to unveil our expertly curated list of 953 Asian Penny Stocks.
- Interested In Other Possibilities? Outshine the giants: these 27 early-stage AI stocks could fund your retirement.
This article by Simply Wall St is general in nature. We provide commentary based on historical data and analyst forecasts only using an unbiased methodology and our articles are not intended to be financial advice. It does not constitute a recommendation to buy or sell any stock, and does not take account of your objectives, or your financial situation. We aim to bring you long-term focused analysis driven by fundamental data. Note that our analysis may not factor in the latest price-sensitive company announcements or qualitative material. Simply Wall St has no position in any stocks mentioned.
New: Manage All Your Stock Portfolios in One Place
We've created the ultimate portfolio companion for stock investors, and it's free.
• Connect an unlimited number of Portfolios and see your total in one currency
• Be alerted to new Warning Signs or Risks via email or mobile
• Track the Fair Value of your stocks
Have feedback on this article? Concerned about the content? Get in touch with us directly. Alternatively, email editorial-team@simplywallst.com
About SZSE:002356
Shenzhen Hemei GroupLTD
Engages in sale of clothing and accessories business in China and internationally.
Flawless balance sheet with weak fundamentals.
Market Insights

Advertisement
Community Narratives
Finding The True Value Of A Logistics Powerhouse
Fair Value US$95.21|8.6% undervalued
NV
Community Contributor
Paradigm Biopharmaceuticals Will Lead Osteoarthritis Treatment with Zilosul's FDA Success
Fair Value AU$5.50|91.9% undervalued
AM
Community Contributor
Barrick Mining (ABX:CA): A Gold Hedge against a U.S. Shutdown
Fair Value CA$60.00|25.6% undervalued
GM
Community Contributor