Shaanxi Xinghua Chemistry Co.,Ltd (SZSE:002109) Soars 26% But It's A Story Of Risk Vs Reward


Those holding Shaanxi Xinghua Chemistry Co.,Ltd (SZSE:002109) shares would be relieved that the share price has rebounded 26% in the last thirty days, but it needs to keep going to repair the recent damage it has caused to investor portfolios. Not all shareholders will be feeling jubilant, since the share price is still down a very disappointing 30% in the last twelve months.
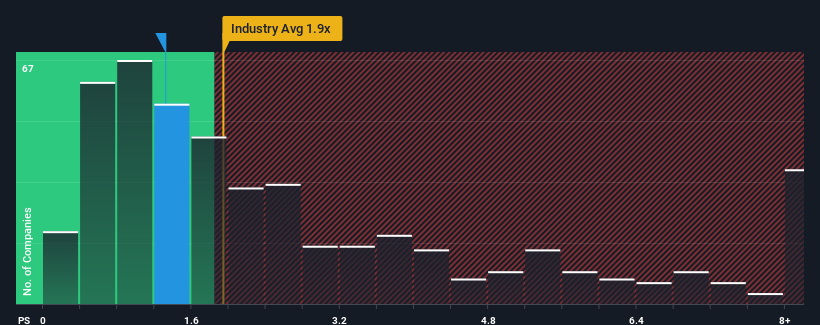
Even after such a large jump in price, Shaanxi Xinghua ChemistryLtd may still be sending bullish signals at the moment with its price-to-sales (or "P/S") ratio of 1.3x, since almost half of all companies in the Chemicals industry in China have P/S ratios greater than 1.9x and even P/S higher than 5x are not unusual. Nonetheless, we'd need to dig a little deeper to determine if there is a rational basis for the reduced P/S.
Check out our latest analysis for Shaanxi Xinghua ChemistryLtd
How Shaanxi Xinghua ChemistryLtd Has Been Performing
Revenue has risen firmly for Shaanxi Xinghua ChemistryLtd recently, which is pleasing to see. It might be that many expect the respectable revenue performance to degrade substantially, which has repressed the P/S. If that doesn't eventuate, then existing shareholders have reason to be optimistic about the future direction of the share price.
Although there are no analyst estimates available for Shaanxi Xinghua ChemistryLtd, take a look at this free data-rich visualisation to see how the company stacks up on earnings, revenue and cash flow.What Are Revenue Growth Metrics Telling Us About The Low P/S?
There's an inherent assumption that a company should underperform the industry for P/S ratios like Shaanxi Xinghua ChemistryLtd's to be considered reasonable.
If we review the last year of revenue growth, the company posted a worthy increase of 11%. The latest three year period has also seen an excellent 96% overall rise in revenue, aided somewhat by its short-term performance. Therefore, it's fair to say the revenue growth recently has been superb for the company.
Weighing that recent medium-term revenue trajectory against the broader industry's one-year forecast for expansion of 25% shows it's about the same on an annualised basis.
In light of this, it's peculiar that Shaanxi Xinghua ChemistryLtd's P/S sits below the majority of other companies. Apparently some shareholders are more bearish than recent times would indicate and have been accepting lower selling prices.
What Does Shaanxi Xinghua ChemistryLtd's P/S Mean For Investors?
The latest share price surge wasn't enough to lift Shaanxi Xinghua ChemistryLtd's P/S close to the industry median. We'd say the price-to-sales ratio's power isn't primarily as a valuation instrument but rather to gauge current investor sentiment and future expectations.
The fact that Shaanxi Xinghua ChemistryLtd currently trades at a low P/S relative to the industry is unexpected considering its recent three-year growth is in line with the wider industry forecast. There could be some unobserved threats to revenue preventing the P/S ratio from matching the company's performance. medium-term
Plus, you should also learn about these 4 warning signs we've spotted with Shaanxi Xinghua ChemistryLtd (including 2 which don't sit too well with us).
If strong companies turning a profit tickle your fancy, then you'll want to check out this free list of interesting companies that trade on a low P/E (but have proven they can grow earnings).
If you're looking to trade Shaanxi Xinghua ChemistryLtd, open an account with the lowest-cost platform trusted by professionals, Interactive Brokers.
With clients in over 200 countries and territories, and access to 160 markets, IBKR lets you trade stocks, options, futures, forex, bonds and funds from a single integrated account.
Enjoy no hidden fees, no account minimums, and FX conversion rates as low as 0.03%, far better than what most brokers offer.
Sponsored ContentNew: Manage All Your Stock Portfolios in One Place
We've created the ultimate portfolio companion for stock investors, and it's free.
• Connect an unlimited number of Portfolios and see your total in one currency
• Be alerted to new Warning Signs or Risks via email or mobile
• Track the Fair Value of your stocks
Have feedback on this article? Concerned about the content? Get in touch with us directly. Alternatively, email editorial-team (at) simplywallst.com.
This article by Simply Wall St is general in nature. We provide commentary based on historical data and analyst forecasts only using an unbiased methodology and our articles are not intended to be financial advice. It does not constitute a recommendation to buy or sell any stock, and does not take account of your objectives, or your financial situation. We aim to bring you long-term focused analysis driven by fundamental data. Note that our analysis may not factor in the latest price-sensitive company announcements or qualitative material. Simply Wall St has no position in any stocks mentioned.
About SZSE:002109
Shaanxi Xinghua ChemistryLtd
Produces and sells ammonium nitrate products primarily in China.
Slightly overvalued very low.
Market Insights

Community Narratives

