
Advertisement
Poly Union Chemical Holding Group Co., Ltd. (SZSE:002037) Not Doing Enough For Some Investors As Its Shares Slump 25%

The Poly Union Chemical Holding Group Co., Ltd. (SZSE:002037) share price has softened a substantial 25% over the previous 30 days, handing back much of the gains the stock has made lately. The drop over the last 30 days has capped off a tough year for shareholders, with the share price down 40% in that time.
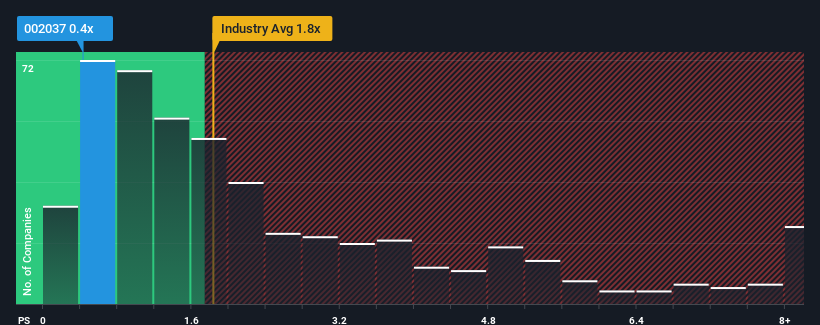
Following the heavy fall in price, Poly Union Chemical Holding Group's price-to-sales (or "P/S") ratio of 0.4x might make it look like a buy right now compared to the Chemicals industry in China, where around half of the companies have P/S ratios above 1.8x and even P/S above 4x are quite common. Nonetheless, we'd need to dig a little deeper to determine if there is a rational basis for the reduced P/S.
Check out our latest analysis for Poly Union Chemical Holding Group
How Has Poly Union Chemical Holding Group Performed Recently?
It looks like revenue growth has deserted Poly Union Chemical Holding Group recently, which is not something to boast about. Perhaps the market believes the recent lacklustre revenue performance is a sign of future underperformance relative to industry peers, hurting the P/S. If you like the company, you'd be hoping this isn't the case so that you could potentially pick up some stock while it's out of favour.
Although there are no analyst estimates available for Poly Union Chemical Holding Group, take a look at this free data-rich visualisation to see how the company stacks up on earnings, revenue and cash flow.How Is Poly Union Chemical Holding Group's Revenue Growth Trending?
There's an inherent assumption that a company should underperform the industry for P/S ratios like Poly Union Chemical Holding Group's to be considered reasonable.
If we review the last year of revenue, the company posted a result that saw barely any deviation from a year ago. The longer-term trend has been no better as the company has no revenue growth to show for over the last three years either. Accordingly, shareholders probably wouldn't have been satisfied with the complete absence of medium-term growth.
Comparing the recent medium-term revenue trends against the industry's one-year growth forecast of 24% shows it's noticeably less attractive.
In light of this, it's understandable that Poly Union Chemical Holding Group's P/S sits below the majority of other companies. Apparently many shareholders weren't comfortable holding on to something they believe will continue to trail the wider industry.
The Bottom Line On Poly Union Chemical Holding Group's P/S
Poly Union Chemical Holding Group's recently weak share price has pulled its P/S back below other Chemicals companies. While the price-to-sales ratio shouldn't be the defining factor in whether you buy a stock or not, it's quite a capable barometer of revenue expectations.
In line with expectations, Poly Union Chemical Holding Group maintains its low P/S on the weakness of its recent three-year growth being lower than the wider industry forecast. At this stage investors feel the potential for an improvement in revenue isn't great enough to justify a higher P/S ratio. If recent medium-term revenue trends continue, it's hard to see the share price experience a reversal of fortunes anytime soon.
It's always necessary to consider the ever-present spectre of investment risk. We've identified 3 warning signs with Poly Union Chemical Holding Group, and understanding these should be part of your investment process.
It's important to make sure you look for a great company, not just the first idea you come across. So if growing profitability aligns with your idea of a great company, take a peek at this free list of interesting companies with strong recent earnings growth (and a low P/E).
New: Manage All Your Stock Portfolios in One Place
We've created the ultimate portfolio companion for stock investors, and it's free.
• Connect an unlimited number of Portfolios and see your total in one currency
• Be alerted to new Warning Signs or Risks via email or mobile
• Track the Fair Value of your stocks
Have feedback on this article? Concerned about the content? Get in touch with us directly. Alternatively, email editorial-team (at) simplywallst.com.
This article by Simply Wall St is general in nature. We provide commentary based on historical data and analyst forecasts only using an unbiased methodology and our articles are not intended to be financial advice. It does not constitute a recommendation to buy or sell any stock, and does not take account of your objectives, or your financial situation. We aim to bring you long-term focused analysis driven by fundamental data. Note that our analysis may not factor in the latest price-sensitive company announcements or qualitative material. Simply Wall St has no position in any stocks mentioned.
Have feedback on this article? Concerned about the content? Get in touch with us directly. Alternatively, email editorial-team@simplywallst.com
About SZSE:002037
Poly Union Chemical Holding Group
Poly Union Chemical Holding Group Co., Ltd.
Questionable track record very low.
Market Insights

Advertisement
Community Narratives
Groundbreaking therapies that could change the treatment landscape for PTSD, fibromyalgia, MS & Alzheimer’s
Fair Value US$6.20|86.8% undervalued
CM
Community Contributor
DigitalOcean Will Grow 14% by Embracing AI with Paperspace Acquisition
Fair Value US$50.00|42.8% undervalued
NE
Community Contributor
Viant Technology: A Rising AdTech Challenger in the AI-Powered CTV Market
Fair Value US$38.61|61.4% undervalued
BL
Community Contributor
Volvo will Accelerate Forward into Electric and Autonomous Leadership in Five Years
Fair Value SEK 438.80|40.8% undervalued
UN
Community Contributor