Improved Revenues Required Before Poly Union Chemical Holding Group Co., Ltd. (SZSE:002037) Stock's 46% Jump Looks Justified


The Poly Union Chemical Holding Group Co., Ltd. (SZSE:002037) share price has done very well over the last month, posting an excellent gain of 46%. Not all shareholders will be feeling jubilant, since the share price is still down a very disappointing 11% in the last twelve months.
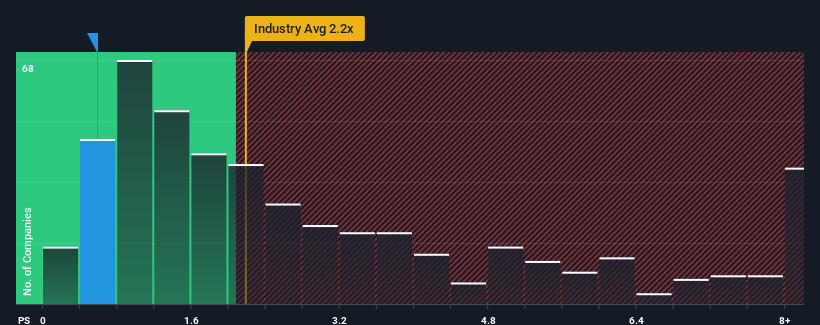
Although its price has surged higher, Poly Union Chemical Holding Group may still be sending buy signals at present with its price-to-sales (or "P/S") ratio of 0.6x, considering almost half of all companies in the Chemicals industry in China have P/S ratios greater than 2.2x and even P/S higher than 5x aren't out of the ordinary. Nonetheless, we'd need to dig a little deeper to determine if there is a rational basis for the reduced P/S.
View our latest analysis for Poly Union Chemical Holding Group
What Does Poly Union Chemical Holding Group's P/S Mean For Shareholders?
We'd have to say that with no tangible growth over the last year, Poly Union Chemical Holding Group's revenue has been unimpressive. It might be that many expect the uninspiring revenue performance to worsen, which has repressed the P/S. If you like the company, you'd be hoping this isn't the case so that you could potentially pick up some stock while it's out of favour.
We don't have analyst forecasts, but you can see how recent trends are setting up the company for the future by checking out our free report on Poly Union Chemical Holding Group's earnings, revenue and cash flow.How Is Poly Union Chemical Holding Group's Revenue Growth Trending?
In order to justify its P/S ratio, Poly Union Chemical Holding Group would need to produce sluggish growth that's trailing the industry.
Retrospectively, the last year delivered virtually the same number to the company's top line as the year before. Likewise, not much has changed from three years ago as revenue have been stuck during that whole time. Accordingly, shareholders probably wouldn't have been satisfied with the complete absence of medium-term growth.
Comparing that to the industry, which is predicted to deliver 23% growth in the next 12 months, the company's momentum is weaker, based on recent medium-term annualised revenue results.
In light of this, it's understandable that Poly Union Chemical Holding Group's P/S sits below the majority of other companies. It seems most investors are expecting to see the recent limited growth rates continue into the future and are only willing to pay a reduced amount for the stock.
The Key Takeaway
The latest share price surge wasn't enough to lift Poly Union Chemical Holding Group's P/S close to the industry median. While the price-to-sales ratio shouldn't be the defining factor in whether you buy a stock or not, it's quite a capable barometer of revenue expectations.
As we suspected, our examination of Poly Union Chemical Holding Group revealed its three-year revenue trends are contributing to its low P/S, given they look worse than current industry expectations. Right now shareholders are accepting the low P/S as they concede future revenue probably won't provide any pleasant surprises. Unless the recent medium-term conditions improve, they will continue to form a barrier for the share price around these levels.
It is also worth noting that we have found 3 warning signs for Poly Union Chemical Holding Group (2 make us uncomfortable!) that you need to take into consideration.
If these risks are making you reconsider your opinion on Poly Union Chemical Holding Group, explore our interactive list of high quality stocks to get an idea of what else is out there.
If you're looking to trade Poly Union Chemical Holding Group, open an account with the lowest-cost platform trusted by professionals, Interactive Brokers.
With clients in over 200 countries and territories, and access to 160 markets, IBKR lets you trade stocks, options, futures, forex, bonds and funds from a single integrated account.
Enjoy no hidden fees, no account minimums, and FX conversion rates as low as 0.03%, far better than what most brokers offer.
Sponsored ContentNew: Manage All Your Stock Portfolios in One Place
We've created the ultimate portfolio companion for stock investors, and it's free.
• Connect an unlimited number of Portfolios and see your total in one currency
• Be alerted to new Warning Signs or Risks via email or mobile
• Track the Fair Value of your stocks
Have feedback on this article? Concerned about the content? Get in touch with us directly. Alternatively, email editorial-team (at) simplywallst.com.
This article by Simply Wall St is general in nature. We provide commentary based on historical data and analyst forecasts only using an unbiased methodology and our articles are not intended to be financial advice. It does not constitute a recommendation to buy or sell any stock, and does not take account of your objectives, or your financial situation. We aim to bring you long-term focused analysis driven by fundamental data. Note that our analysis may not factor in the latest price-sensitive company announcements or qualitative material. Simply Wall St has no position in any stocks mentioned.
About SZSE:002037
Poly Union Chemical Holding Group
Poly Union Chemical Holding Group Co., Ltd.
Questionable track record very low.
Market Insights

Community Narratives

