Improved Revenues Required Before Poly Union Chemical Holding Group Co., Ltd. (SZSE:002037) Stock's 27% Jump Looks Justified


Poly Union Chemical Holding Group Co., Ltd. (SZSE:002037) shareholders are no doubt pleased to see that the share price has bounced 27% in the last month, although it is still struggling to make up recently lost ground. Unfortunately, the gains of the last month did little to right the losses of the last year with the stock still down 41% over that time.
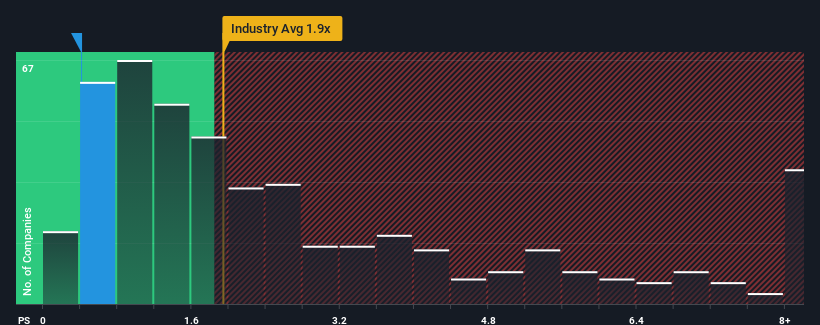
Even after such a large jump in price, Poly Union Chemical Holding Group's price-to-sales (or "P/S") ratio of 0.4x might still make it look like a buy right now compared to the Chemicals industry in China, where around half of the companies have P/S ratios above 1.9x and even P/S above 5x are quite common. Nonetheless, we'd need to dig a little deeper to determine if there is a rational basis for the reduced P/S.
Check out our latest analysis for Poly Union Chemical Holding Group
What Does Poly Union Chemical Holding Group's Recent Performance Look Like?
Poly Union Chemical Holding Group has been doing a good job lately as it's been growing revenue at a solid pace. It might be that many expect the respectable revenue performance to degrade substantially, which has repressed the P/S. If you like the company, you'd be hoping this isn't the case so that you could potentially pick up some stock while it's out of favour.
Want the full picture on earnings, revenue and cash flow for the company? Then our free report on Poly Union Chemical Holding Group will help you shine a light on its historical performance.Is There Any Revenue Growth Forecasted For Poly Union Chemical Holding Group?
There's an inherent assumption that a company should underperform the industry for P/S ratios like Poly Union Chemical Holding Group's to be considered reasonable.
If we review the last year of revenue growth, the company posted a worthy increase of 15%. Pleasingly, revenue has also lifted 34% in aggregate from three years ago, partly thanks to the last 12 months of growth. Therefore, it's fair to say the revenue growth recently has been superb for the company.
This is in contrast to the rest of the industry, which is expected to grow by 25% over the next year, materially higher than the company's recent medium-term annualised growth rates.
With this in consideration, it's easy to understand why Poly Union Chemical Holding Group's P/S falls short of the mark set by its industry peers. It seems most investors are expecting to see the recent limited growth rates continue into the future and are only willing to pay a reduced amount for the stock.
The Final Word
The latest share price surge wasn't enough to lift Poly Union Chemical Holding Group's P/S close to the industry median. Using the price-to-sales ratio alone to determine if you should sell your stock isn't sensible, however it can be a practical guide to the company's future prospects.
In line with expectations, Poly Union Chemical Holding Group maintains its low P/S on the weakness of its recent three-year growth being lower than the wider industry forecast. Right now shareholders are accepting the low P/S as they concede future revenue probably won't provide any pleasant surprises. Unless the recent medium-term conditions improve, they will continue to form a barrier for the share price around these levels.
There are also other vital risk factors to consider before investing and we've discovered 2 warning signs for Poly Union Chemical Holding Group that you should be aware of.
It's important to make sure you look for a great company, not just the first idea you come across. So if growing profitability aligns with your idea of a great company, take a peek at this free list of interesting companies with strong recent earnings growth (and a low P/E).
If you're looking to trade Poly Union Chemical Holding Group, open an account with the lowest-cost platform trusted by professionals, Interactive Brokers.
With clients in over 200 countries and territories, and access to 160 markets, IBKR lets you trade stocks, options, futures, forex, bonds and funds from a single integrated account.
Enjoy no hidden fees, no account minimums, and FX conversion rates as low as 0.03%, far better than what most brokers offer.
Sponsored ContentNew: Manage All Your Stock Portfolios in One Place
We've created the ultimate portfolio companion for stock investors, and it's free.
• Connect an unlimited number of Portfolios and see your total in one currency
• Be alerted to new Warning Signs or Risks via email or mobile
• Track the Fair Value of your stocks
Have feedback on this article? Concerned about the content? Get in touch with us directly. Alternatively, email editorial-team (at) simplywallst.com.
This article by Simply Wall St is general in nature. We provide commentary based on historical data and analyst forecasts only using an unbiased methodology and our articles are not intended to be financial advice. It does not constitute a recommendation to buy or sell any stock, and does not take account of your objectives, or your financial situation. We aim to bring you long-term focused analysis driven by fundamental data. Note that our analysis may not factor in the latest price-sensitive company announcements or qualitative material. Simply Wall St has no position in any stocks mentioned.
About SZSE:002037
Poly Union Chemical Holding Group
Poly Union Chemical Holding Group Co., Ltd.
Questionable track record very low.
Market Insights

Community Narratives

