
Advertisement
- China
- /
- Metals and Mining
- /
- SZSE:000762
Market Might Still Lack Some Conviction On Tibet Mineral Development Co., LTD (SZSE:000762) Even After 29% Share Price Boost
Those holding Tibet Mineral Development Co., LTD (SZSE:000762) shares would be relieved that the share price has rebounded 29% in the last thirty days, but it needs to keep going to repair the recent damage it has caused to investor portfolios. Not all shareholders will be feeling jubilant, since the share price is still down a very disappointing 40% in the last twelve months.
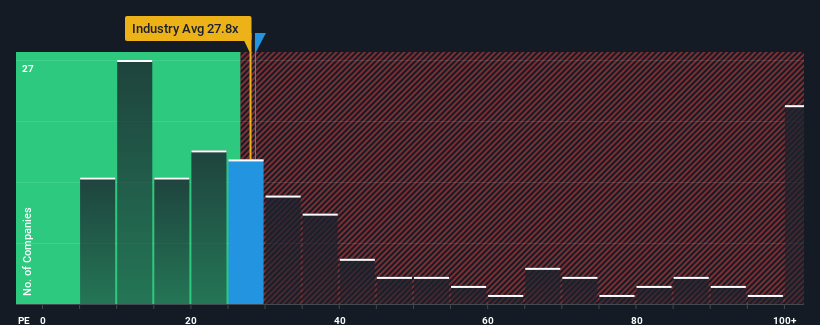
In spite of the firm bounce in price, it's still not a stretch to say that Tibet Mineral Development's price-to-earnings (or "P/E") ratio of 28.6x right now seems quite "middle-of-the-road" compared to the market in China, where the median P/E ratio is around 30x. While this might not raise any eyebrows, if the P/E ratio is not justified investors could be missing out on a potential opportunity or ignoring looming disappointment.
For instance, Tibet Mineral Development's receding earnings in recent times would have to be some food for thought. It might be that many expect the company to put the disappointing earnings performance behind them over the coming period, which has kept the P/E from falling. If you like the company, you'd at least be hoping this is the case so that you could potentially pick up some stock while it's not quite in favour.
View our latest analysis for Tibet Mineral Development
Does Growth Match The P/E?
In order to justify its P/E ratio, Tibet Mineral Development would need to produce growth that's similar to the market.
Taking a look back first, the company's earnings per share growth last year wasn't something to get excited about as it posted a disappointing decline of 12%. However, a few very strong years before that means that it was still able to grow EPS by an impressive 576% in total over the last three years. So we can start by confirming that the company has generally done a very good job of growing earnings over that time, even though it had some hiccups along the way.
This is in contrast to the rest of the market, which is expected to grow by 41% over the next year, materially lower than the company's recent medium-term annualised growth rates.
In light of this, it's curious that Tibet Mineral Development's P/E sits in line with the majority of other companies. It may be that most investors are not convinced the company can maintain its recent growth rates.
The Final Word
Tibet Mineral Development's stock has a lot of momentum behind it lately, which has brought its P/E level with the market. Using the price-to-earnings ratio alone to determine if you should sell your stock isn't sensible, however it can be a practical guide to the company's future prospects.
Our examination of Tibet Mineral Development revealed its three-year earnings trends aren't contributing to its P/E as much as we would have predicted, given they look better than current market expectations. When we see strong earnings with faster-than-market growth, we assume potential risks are what might be placing pressure on the P/E ratio. It appears some are indeed anticipating earnings instability, because the persistence of these recent medium-term conditions would normally provide a boost to the share price.
Before you take the next step, you should know about the 1 warning sign for Tibet Mineral Development that we have uncovered.
Of course, you might find a fantastic investment by looking at a few good candidates. So take a peek at this free list of companies with a strong growth track record, trading on a low P/E.
New: AI Stock Screener & Alerts
Our new AI Stock Screener scans the market every day to uncover opportunities.
• Dividend Powerhouses (3%+ Yield)
• Undervalued Small Caps with Insider Buying
• High growth Tech and AI Companies
Or build your own from over 50 metrics.
Have feedback on this article? Concerned about the content? Get in touch with us directly. Alternatively, email editorial-team (at) simplywallst.com.
This article by Simply Wall St is general in nature. We provide commentary based on historical data and analyst forecasts only using an unbiased methodology and our articles are not intended to be financial advice. It does not constitute a recommendation to buy or sell any stock, and does not take account of your objectives, or your financial situation. We aim to bring you long-term focused analysis driven by fundamental data. Note that our analysis may not factor in the latest price-sensitive company announcements or qualitative material. Simply Wall St has no position in any stocks mentioned.
About SZSE:000762
Imperfect balance sheet with minimal risk.
Market Insights

Advertisement
Community Narratives
The company that turned a verb into a global necessity and basically runs the modern internet, digital ads, smartphones, maps, and AI.
Fair Value US$300.00|6.3% undervalued
OS
Community Contributor
Flowers Foods Pays A Fair Price For Health
Fair Value US$16.12|26.0% undervalued
NV
Community Contributor
TMX Group will thrive with 33.3% profit margin and enduring market moat
Fair Value CA$49.90|3.7% overvalued
LI
Community Contributor